DVWA Recon Medium Sec - Red Blue Purple Team

The first post in the DVWA Medium Security Shieldia blog series. Today I demonstrate how to obfuscate the reconnaissance phase to give the defenders even less time to react. Active network reconnaissance has three primary obfuscations; send less packets from a single source, slow down the scan a lot, maintain the total number of packets from different source IP addresses. Advanced packet manipulation techniques will be discussed in the High Security Recon post. Regarding the active web app recon I provide methods to “blend in” with normal traffic, going further I demonstrate how to use the HEAD method to obfuscate our activity against traditional detection rules. Finally for the Red Team perspective I provide a method to Brute Force the main login page with an “undocumented” bug.
The Blue Team perspective covers how to install Mod Security, download and use the OWASP Core Rule Set (CRS), and how to write ModSec rules. I’ve updated the Elastic Sigma rules to detect the obfuscated Red Team activity.
Prerequisites
If you don’t currently have a Damn Vulnerable Web Application (DVWA) instance you can follow along at home with a simple git clone & vagrant up if your host system meets the minimum specs.
Red team only deploys Opnsense, DVWA, and Kali.
Blue Team deploys the whole environment.
Recon Medium Sec - Red Team
Due to the detection logic we know is in place from the Blue Team post we will by default implement some obfuscations.
Detection infrastructure we are aware of:
- Opnsense firewall (on Low Sec without Sericata, but that might change)
- Apache logging to
access.loganderror.log(No POST request logging) - Elastic Agent observing process activity
- Auditd monitoring process activity
The nature of the deployment means we only have access to active reconnaissance methods, we do not have the luxury of OSINT (Open Source INTelligence). We must alter our ways to remain undetected, or at least blend in with the crowd!
If you are NOT using the Tartarus Lab add the DVWA node to your Kali guests’ hosts file:
On a fresh install you must enable the backend database
username: admin
password: password
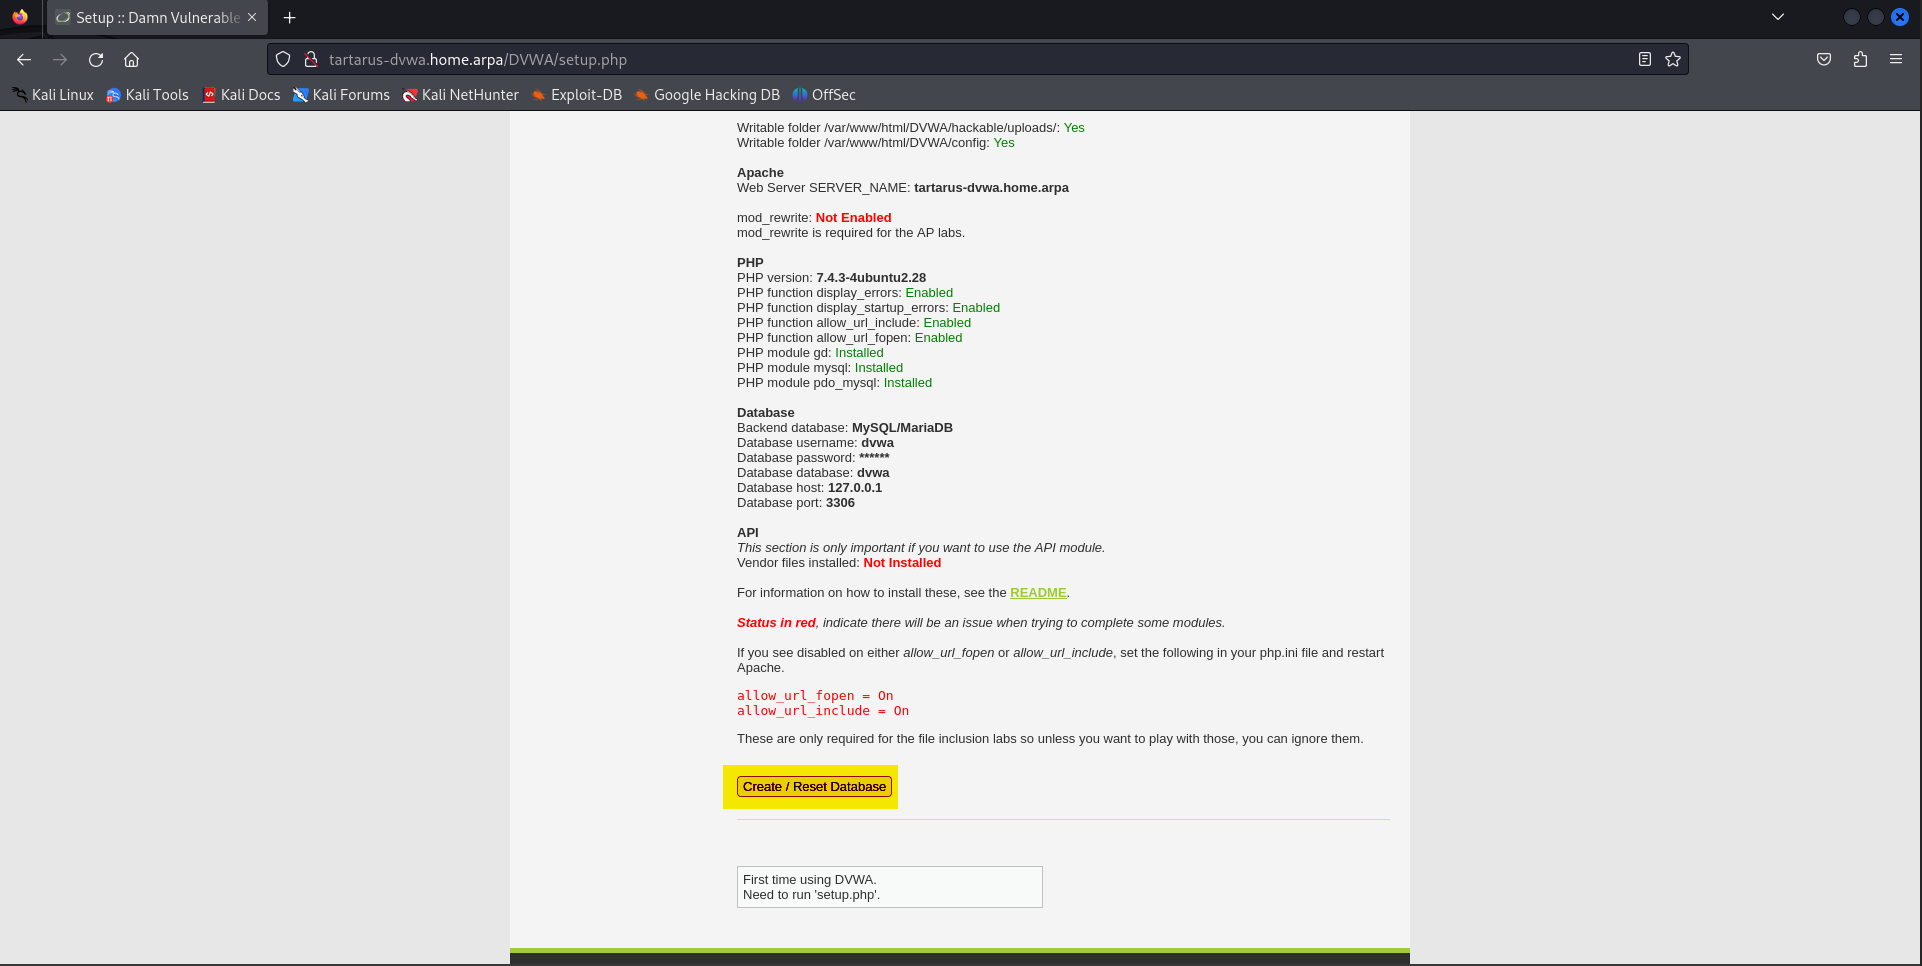 Example enable the DVWA database
Nmap
Since we know about the detection infrastructure within the Tartarus environment and rules that are in place to identify our activity we must adapt how we do our active recon.
If we did the scan from the Recon Low Sec post:
1
sudo nmap -vvv -A -sS -p- tartarus-dvwa.home.arpa
We know this would trigger the following rules:
- pfSense Correlation Port Scan Activity
- Web Apache Correlation Hack Tool User Agent
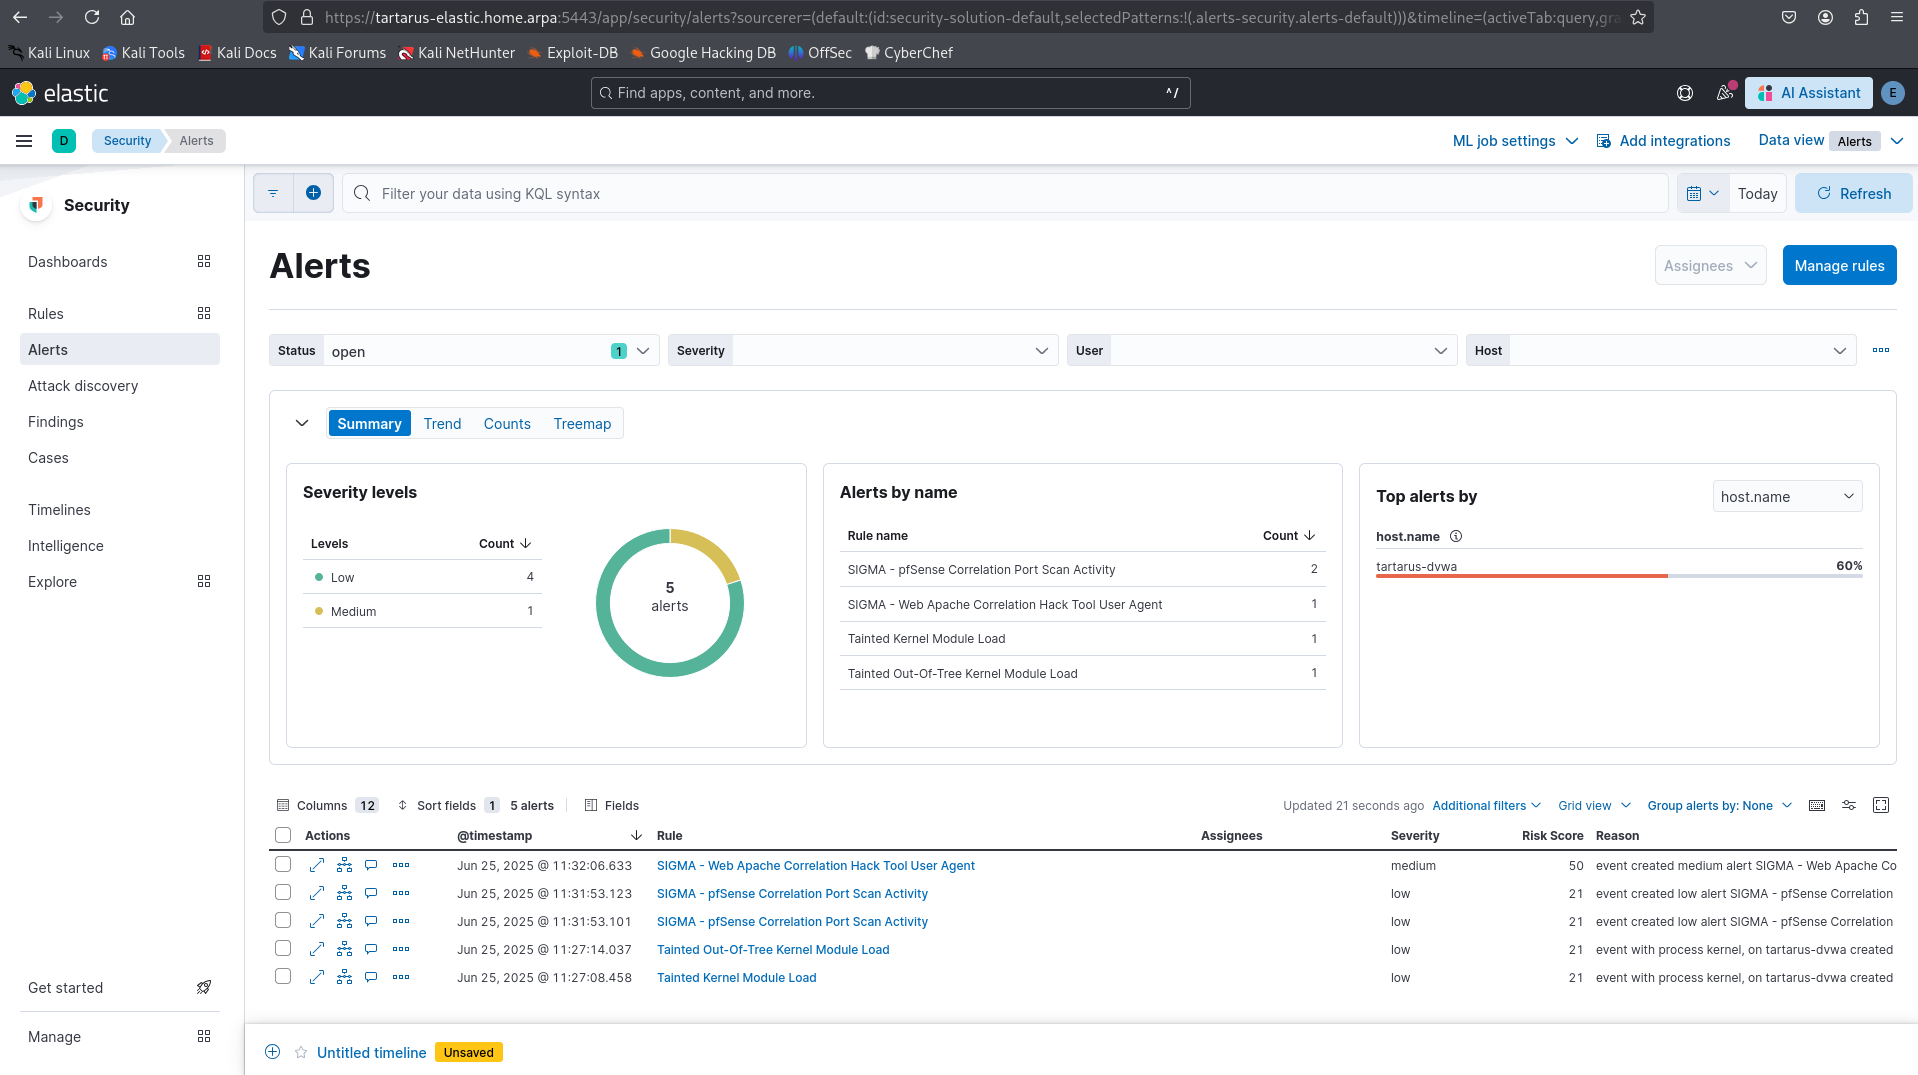 Example alerts in elastic to detect recon attempts
This isn’t good enough.
Side Channel: Nmap Obfuscations
Some obvious “obfuscations” would be as follows. We want to remain undetected for as long as possible and not give the Blue Team any time to react. Insert some Sun Tzu / Carl von Clausewitz quote here. ;)
“Make a false move, not to pass it for a genuine one but to transform it into a genuine one after the enemy has been convinced of its falsity.”
– The Wiles of War, trans. Sun Haichen (via Robert Greene, The 33 Strategies of War, 2007).
Top ports
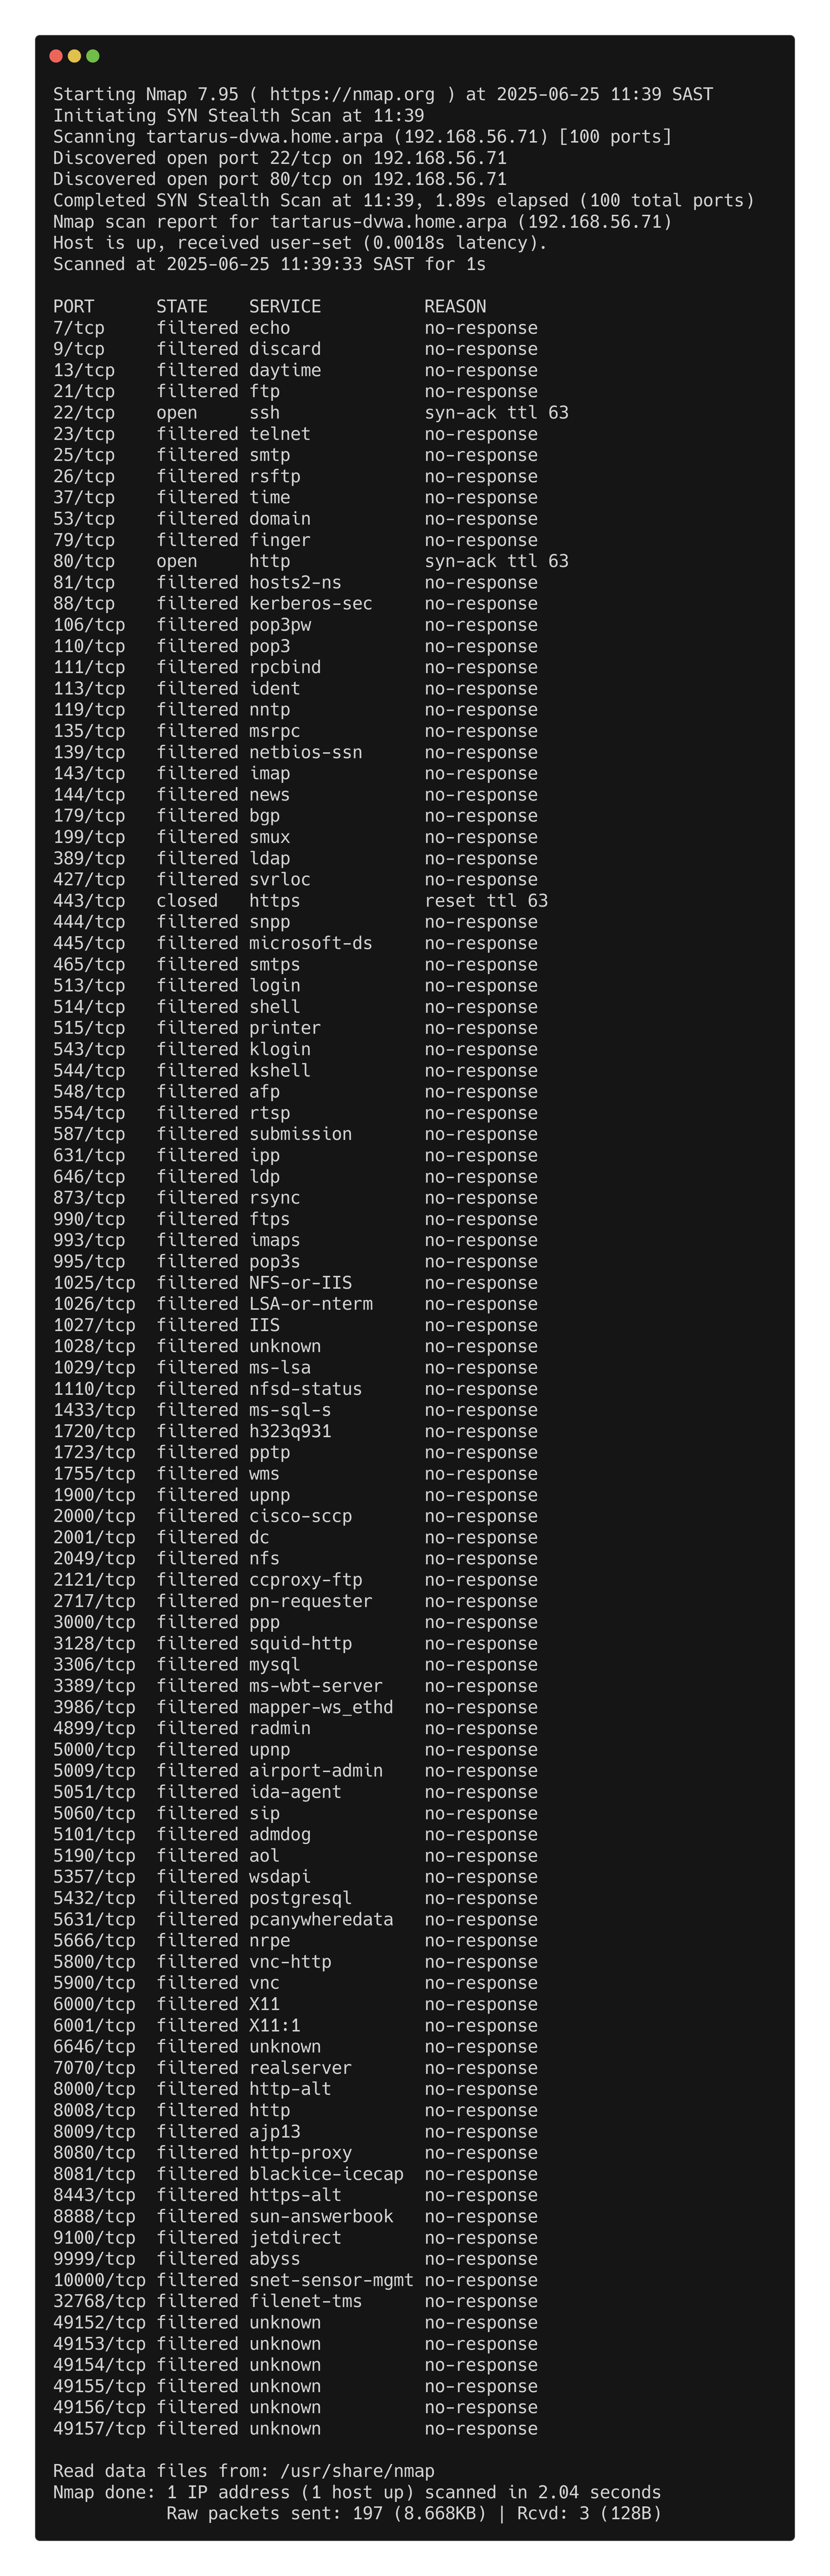
Limit the scan to only focus on the top 100 ports. This has the effect of just sending less packets to the target so they’ll have a smaller window to catch the activity.
1
sudo nmap -Pn -vvv -sS --top-ports 100 tartarus-dvwa.home.arpa
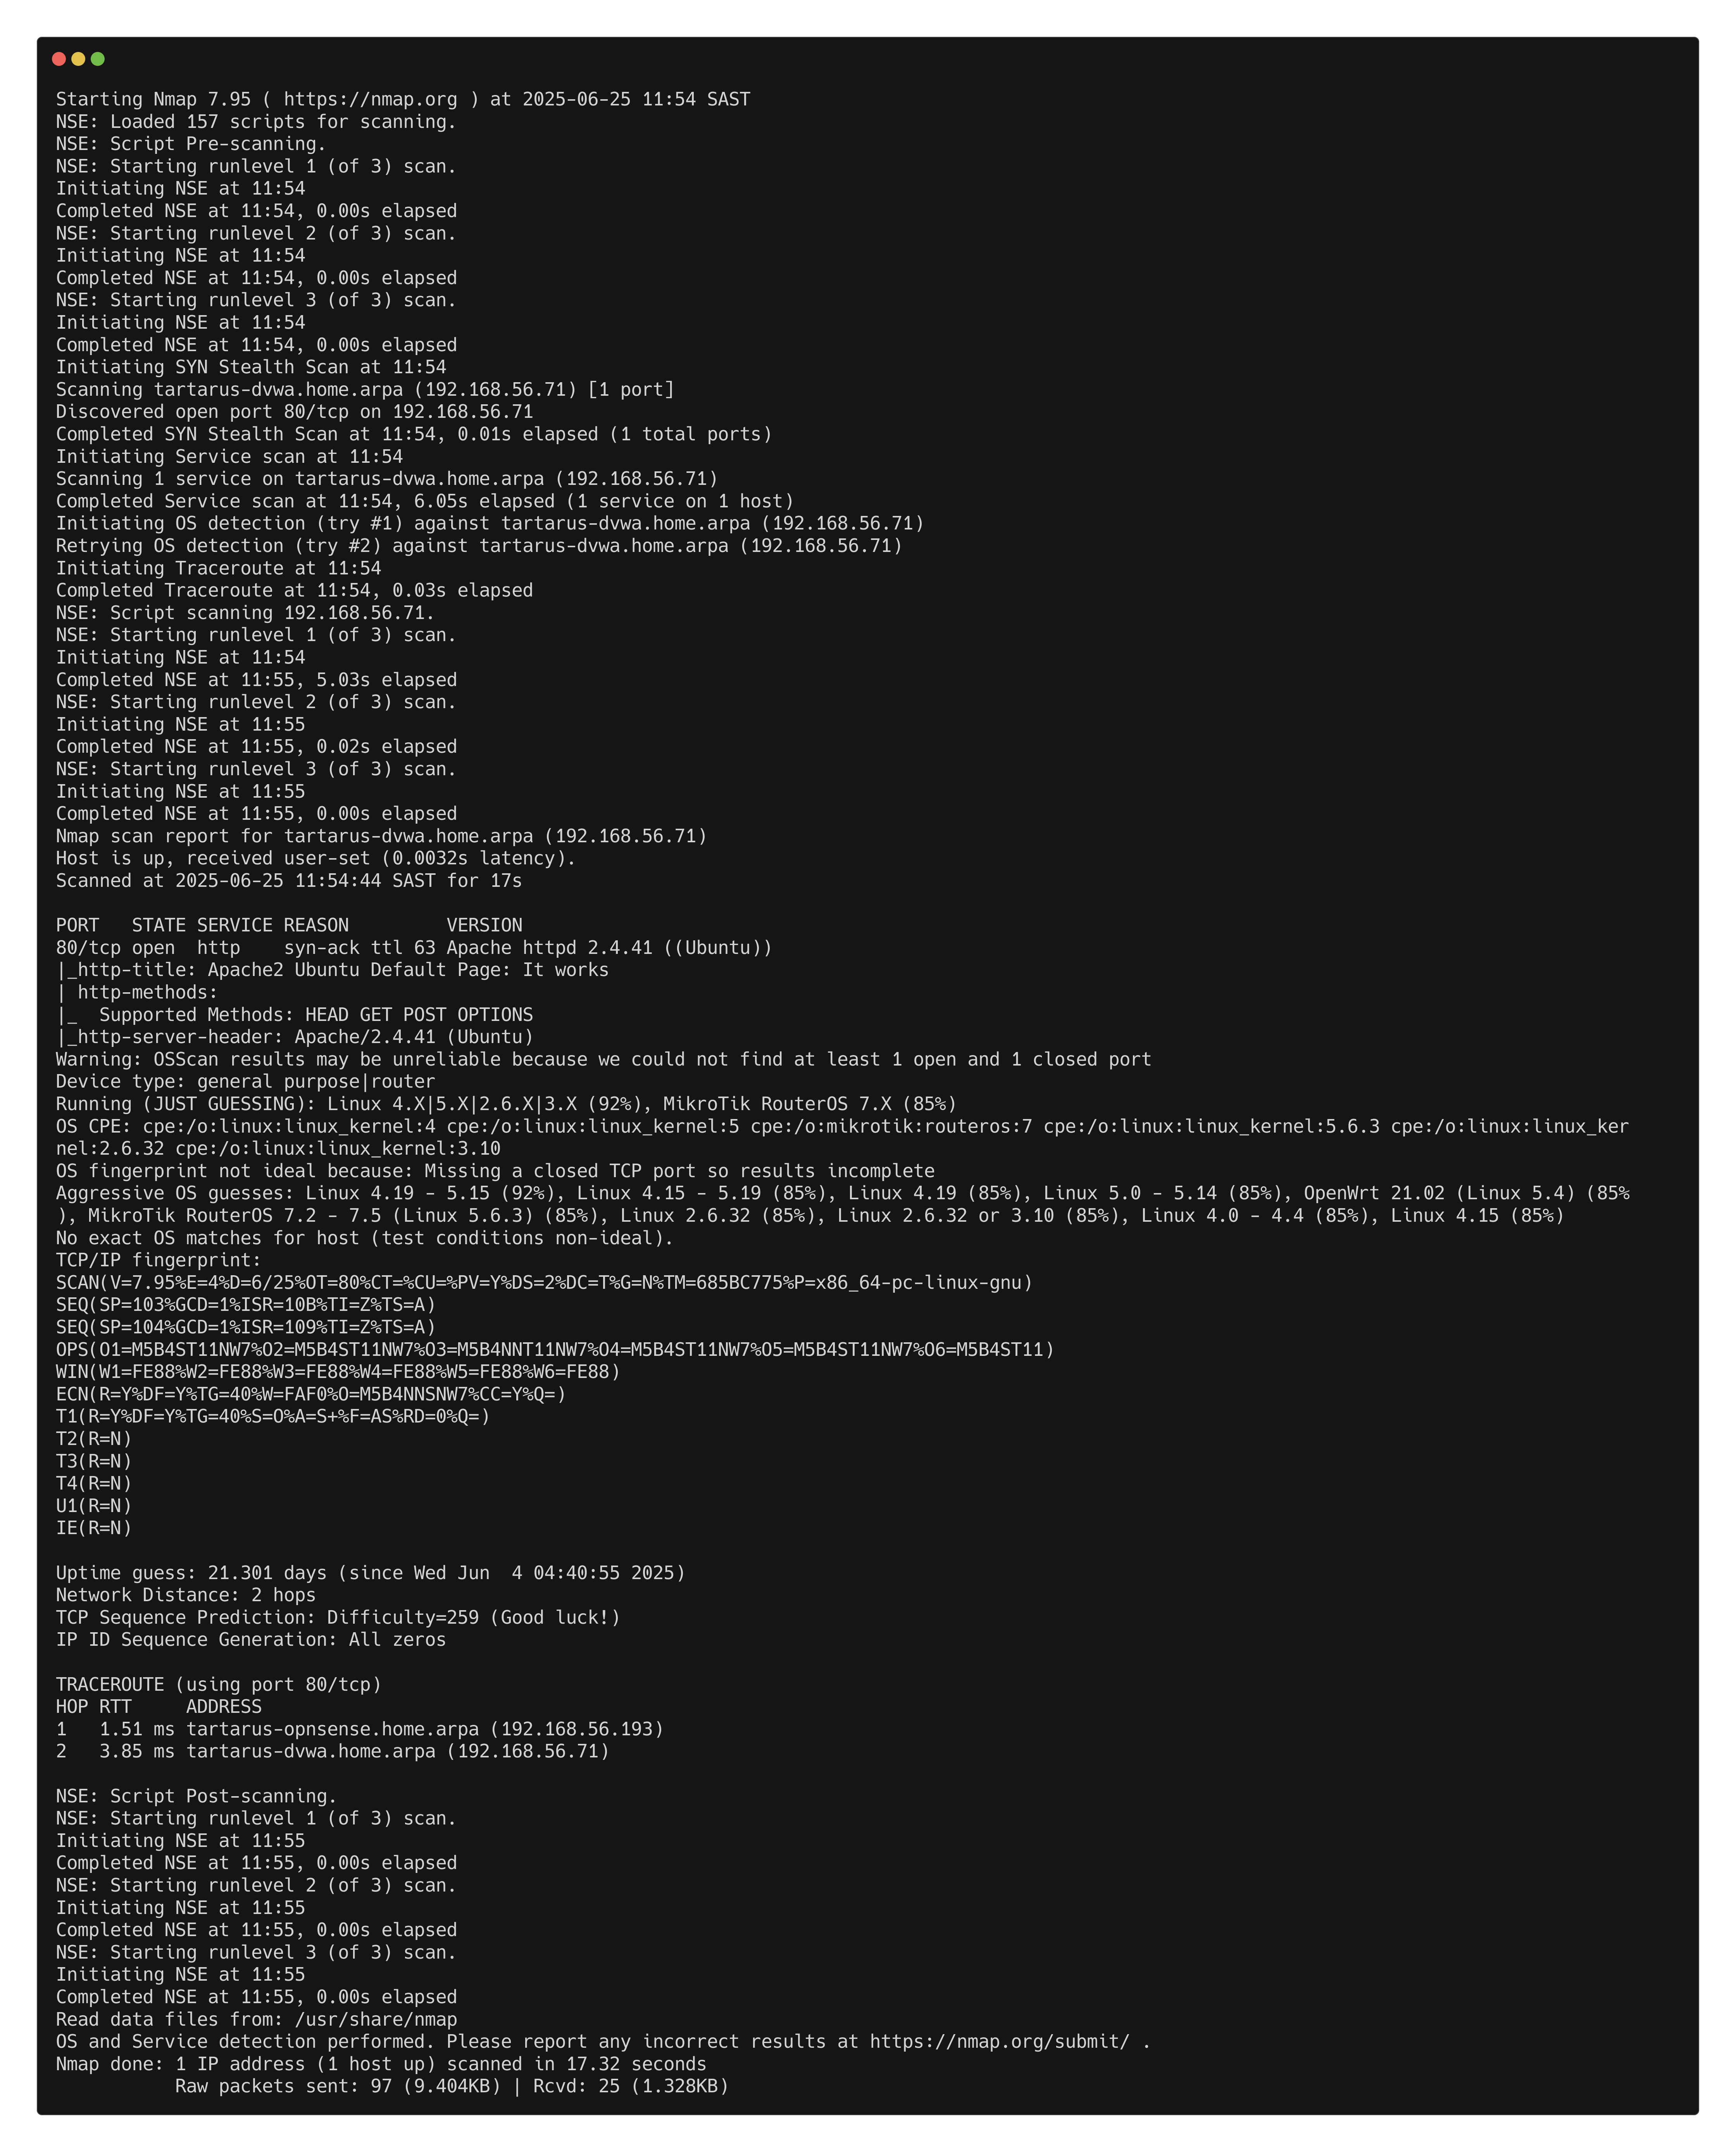
This is better since it doesn’t have the -A flag we don’t send any HTTP requests to the open webserver ports, and are only focused on the top 100 most commonly open ports.
 Example top ports nmap scan
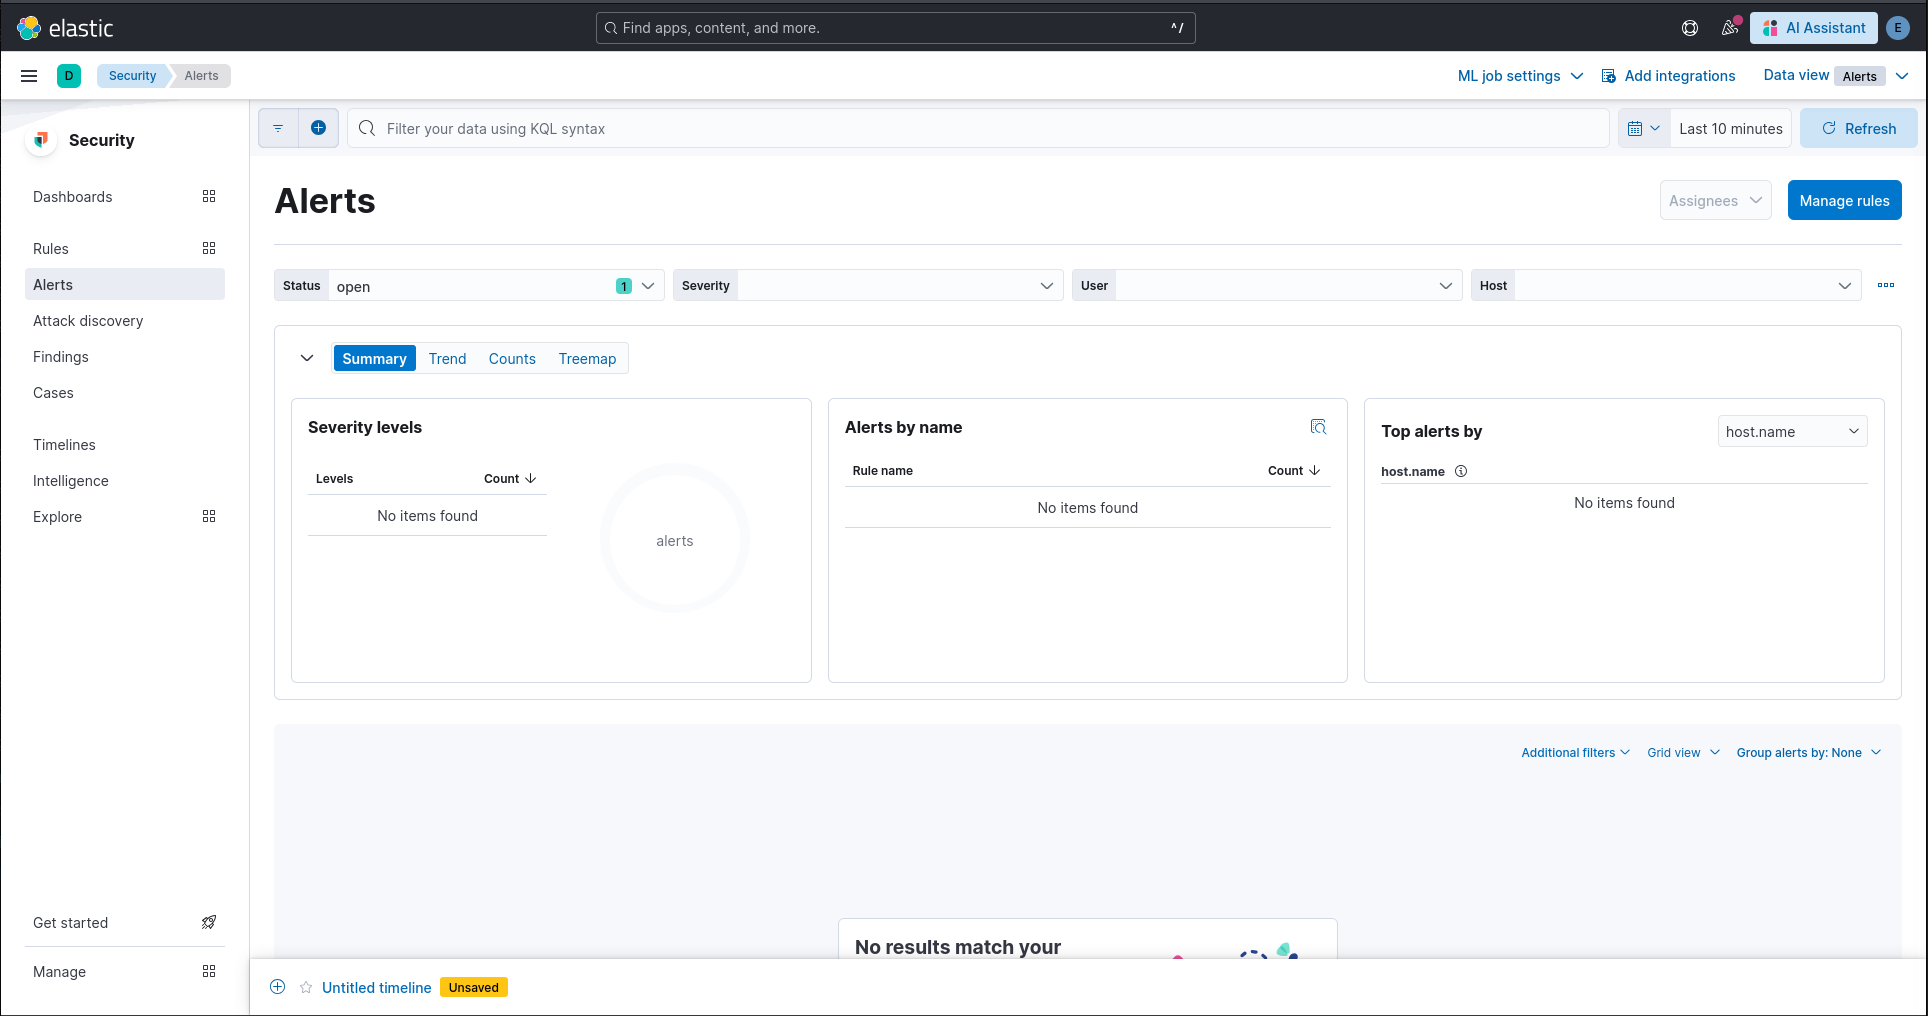 Elastic no alerts from nmap scan
Here we can clearly see ports 22 (SSH, not in scope) and port 80 (HTTP) are open, we can then target the in scope port with more focused scans.
1
sudo nmap -A -Pn -p 80 -vvv --script-args http.useragent="User-Agent: Mozilla/5.0 (Windows NT 10.0; Win64; x64) AppleWebKit/537.36 (KHTML, like Gecko) Chrome/132.0.0.0 Safari/537.3" tartarus-dvwa.home.arpa
 Example targeted custom user-agent namp web scan
This gives us a detailed breakdown, the same as before importantly this time we haven’t raised any alarms:
No alerts in siem
Slow Down The Scan
Or if you had all day and night for like a month :)
This has the effect of slowing the scan right down so the normal detection rubric of “if X packets, in Y time, from Z source to A destination” we break the flow by expanding the time to something unreasonable.
1
sudo nmap -vvv -sS -p- -T 1 tartarus-dvwa.home.arpa
For all 65k ports this will take a very long time, ok if you’re a TA and have all the time in the world, not if you are on a tight schedule though.
I won’t mention Zombie scanning or packet manipulation here as we will cover more advanced recon in the High Security post.
Multiple Source IP Addresses
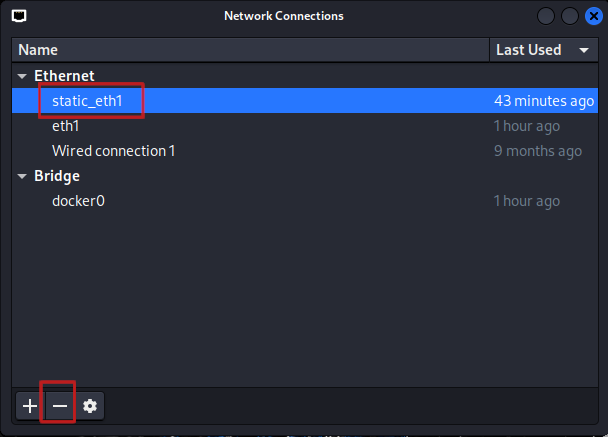
And finally what if they have more than 1 IP address? For the sake of example I will use the namp -S flag with valid source IP addresses within the Tartarus Lab. Since the Hackers zone is a /26 and only 2 IP address are assigned (Kali and Firewall) we can inflate into the rest, then set the source IP address of a scan to each of the addresses and do a real sneaky beaky scan (importantly get the results!). This has the effect of limiting the total number of packets sent from each IP address, while maintaining the total number of packets sent.
First you can assign all the IP addresses with the following script
This will bork the network connectivity of the Kali guest so once done just delete the static_eht1 interface!
Create the following file called assign_ips.sh:
1
2
3
4
5
6
7
8
9
10
11
12
13
14
15
16
17
18
19
20
21
22
23
24
25
26
27
28
29
30
31
32
#!/bin/bash

INTERFACE="eth1"
CON_NAME="static_eth1"
SUBNET_BASE="192.168.56"
START_IP=193  # First usable IP in /26
END_IP=254    # Last usable IP in /26
EXCLUDE_IP=200  # The primary IP is already assigned

# Check if the connection exists, create it if not
if ! nmcli connection show "$CON_NAME" &>/dev/null; then
    echo "Creating new connection profile: $CON_NAME..."
    nmcli connection add type ethernet con-name "$CON_NAME" ifname "$INTERFACE" ip4 "$SUBNET_BASE.$EXCLUDE_IP/26" gw4 192.168.56.193
fi

# Bring up the connection if it's down
echo "Ensuring the connection is active..."
nmcli connection up "$CON_NAME" || { echo "Error: Failed to activate connection"; exit 1; }

# Assign secondary IPs
for ((IP=START_IP; IP<=END_IP; IP++)); do
    if [[ $IP -ne $EXCLUDE_IP ]]; then
        echo "Assigning $SUBNET_BASE.$IP to $INTERFACE..."
        nmcli connection modify "$CON_NAME" +ipv4.addresses "$SUBNET_BASE.$IP/26"
    fi
done

# Apply changes
nmcli connection down "$CON_NAME"
nmcli connection up "$CON_NAME"

echo "All additional IPs assigned."
Now run the file with a little:
1
bash assign_ips.sh
You can confirm it worked with:
1
ip -o addr show dev eth1
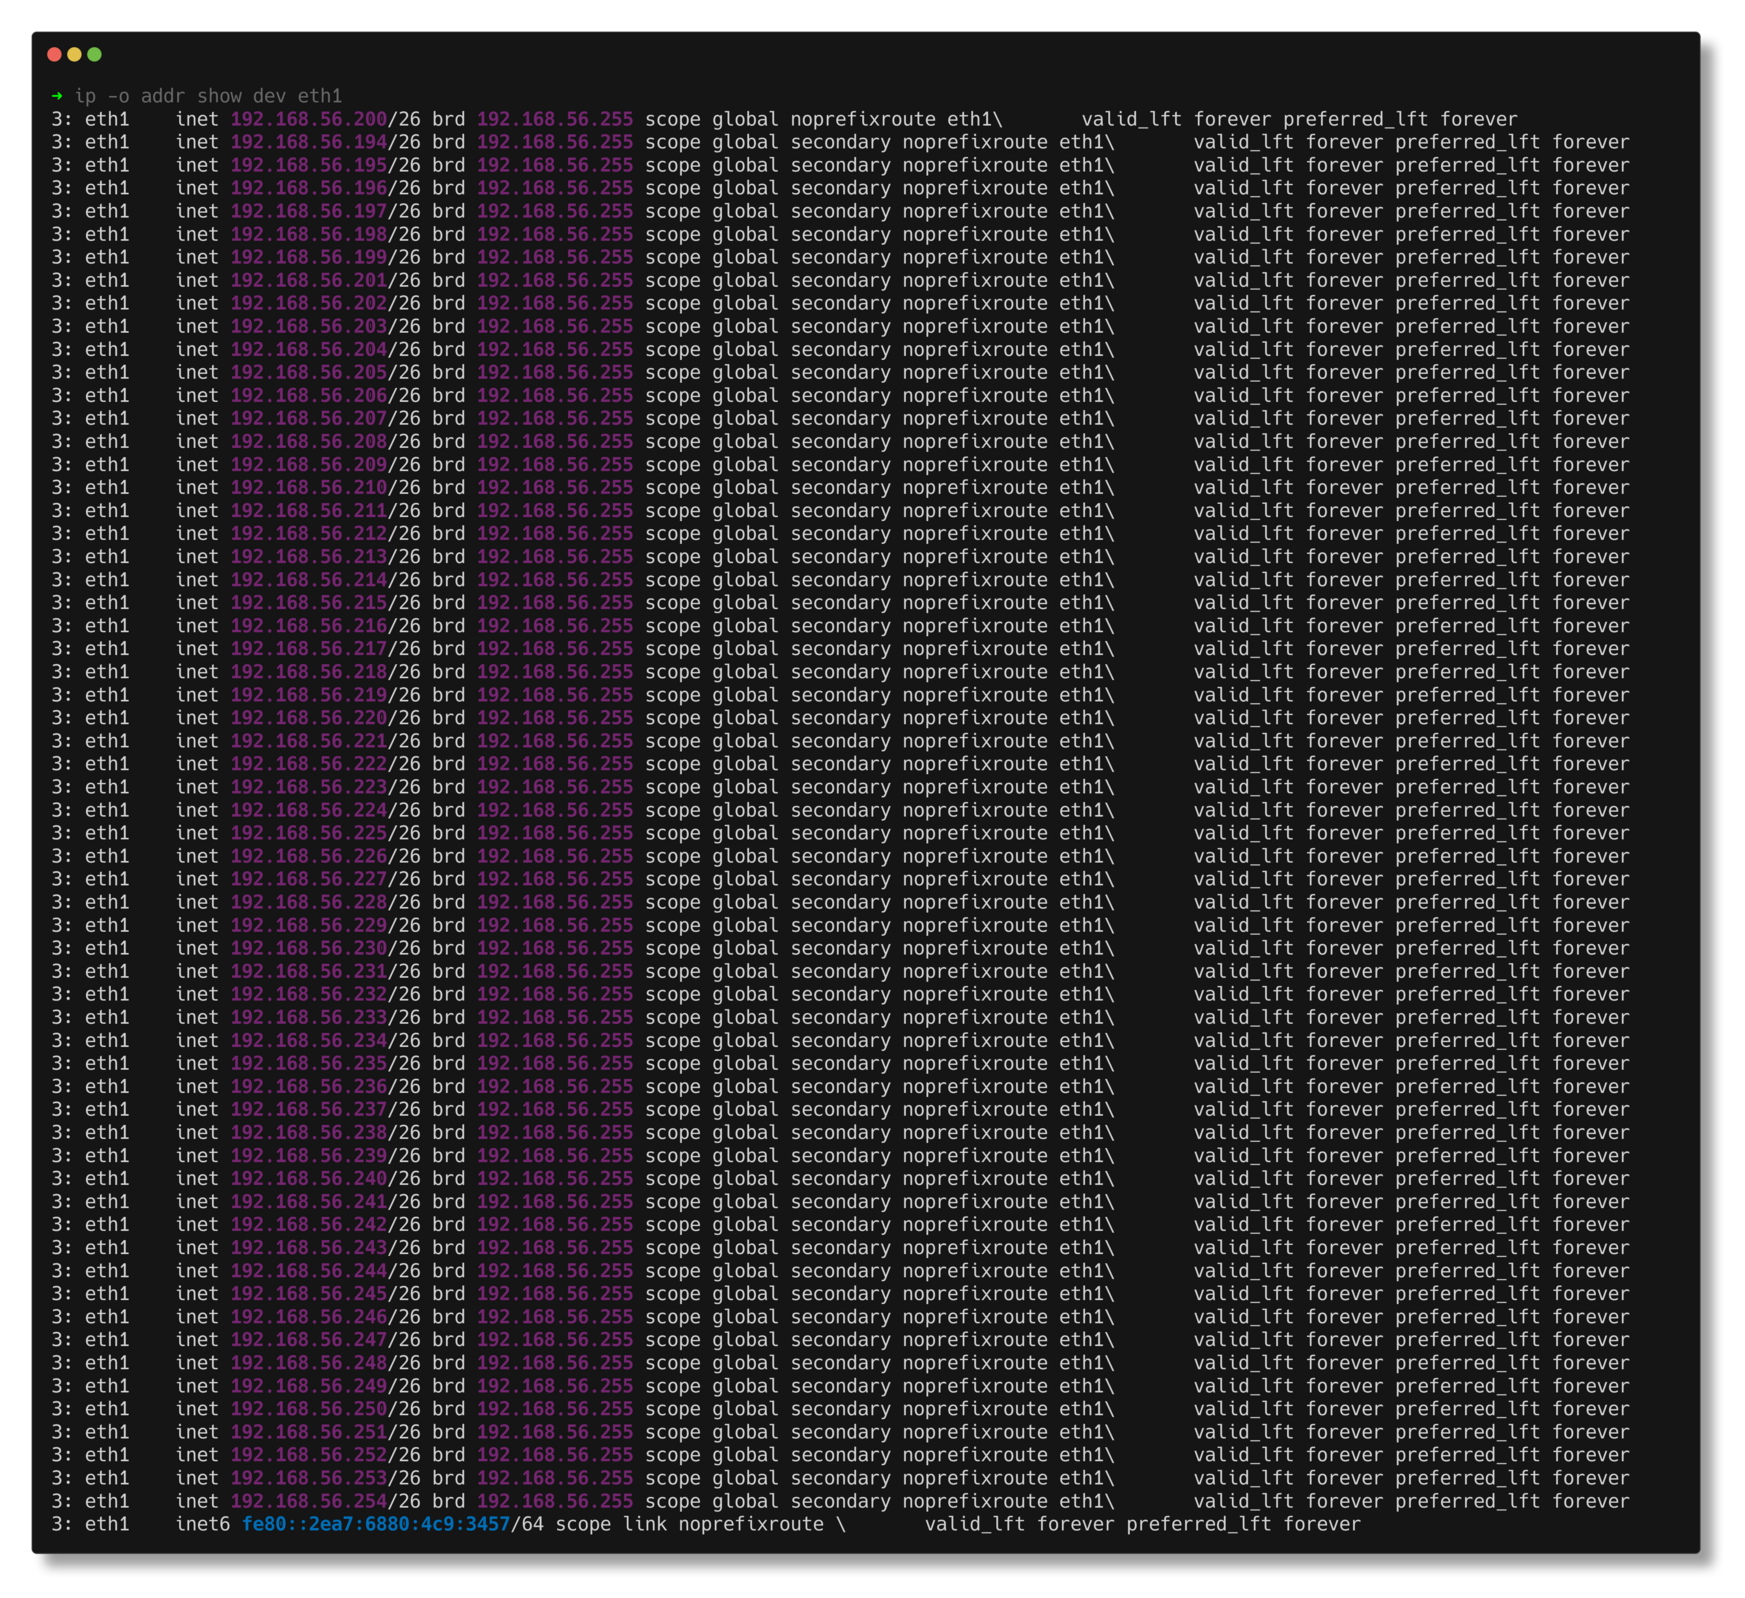 Example output working assign ips script
Now create another file called nmap_scan.sh:
1
2
3
4
5
6
7
8
9
10
11
12
13
14
15
16
17
18
19
20
21
22
23
24
#!/bin/bash

TARGET_IP="192.168.56.71"
PORT_START=1
PORT_END=50000
PORT_STEP=900

# Detect assigned secondary IPs, excluding .200
SOURCE_IPS=($(ip -o addr show dev eth1 | awk '/192\.168\.56\./ {print $4}' | cut -d'/' -f1 | grep -v "192.168.56.200"))

for ((PORT=$PORT_START; PORT<=$PORT_END; PORT+=$PORT_STEP)); do
    # Select a source IP in round-robin fashion
    INDEX=$(( (PORT / PORT_STEP) % ${#SOURCE_IPS[@]} ))
    SRC_IP=${SOURCE_IPS[$INDEX]}

    echo "Scanning ports $PORT-$((PORT+PORT_STEP-1)) from $SRC_IP..."

    sudo nmap -S $SRC_IP -p $PORT-$((PORT+PORT_STEP-1)) -Pn $TARGET_IP &

    sleep 1  # Slight delay to avoid overwhelming network
done

wait
echo "Scan complete."
And run the scan with:
1
bash nmap_scan.sh
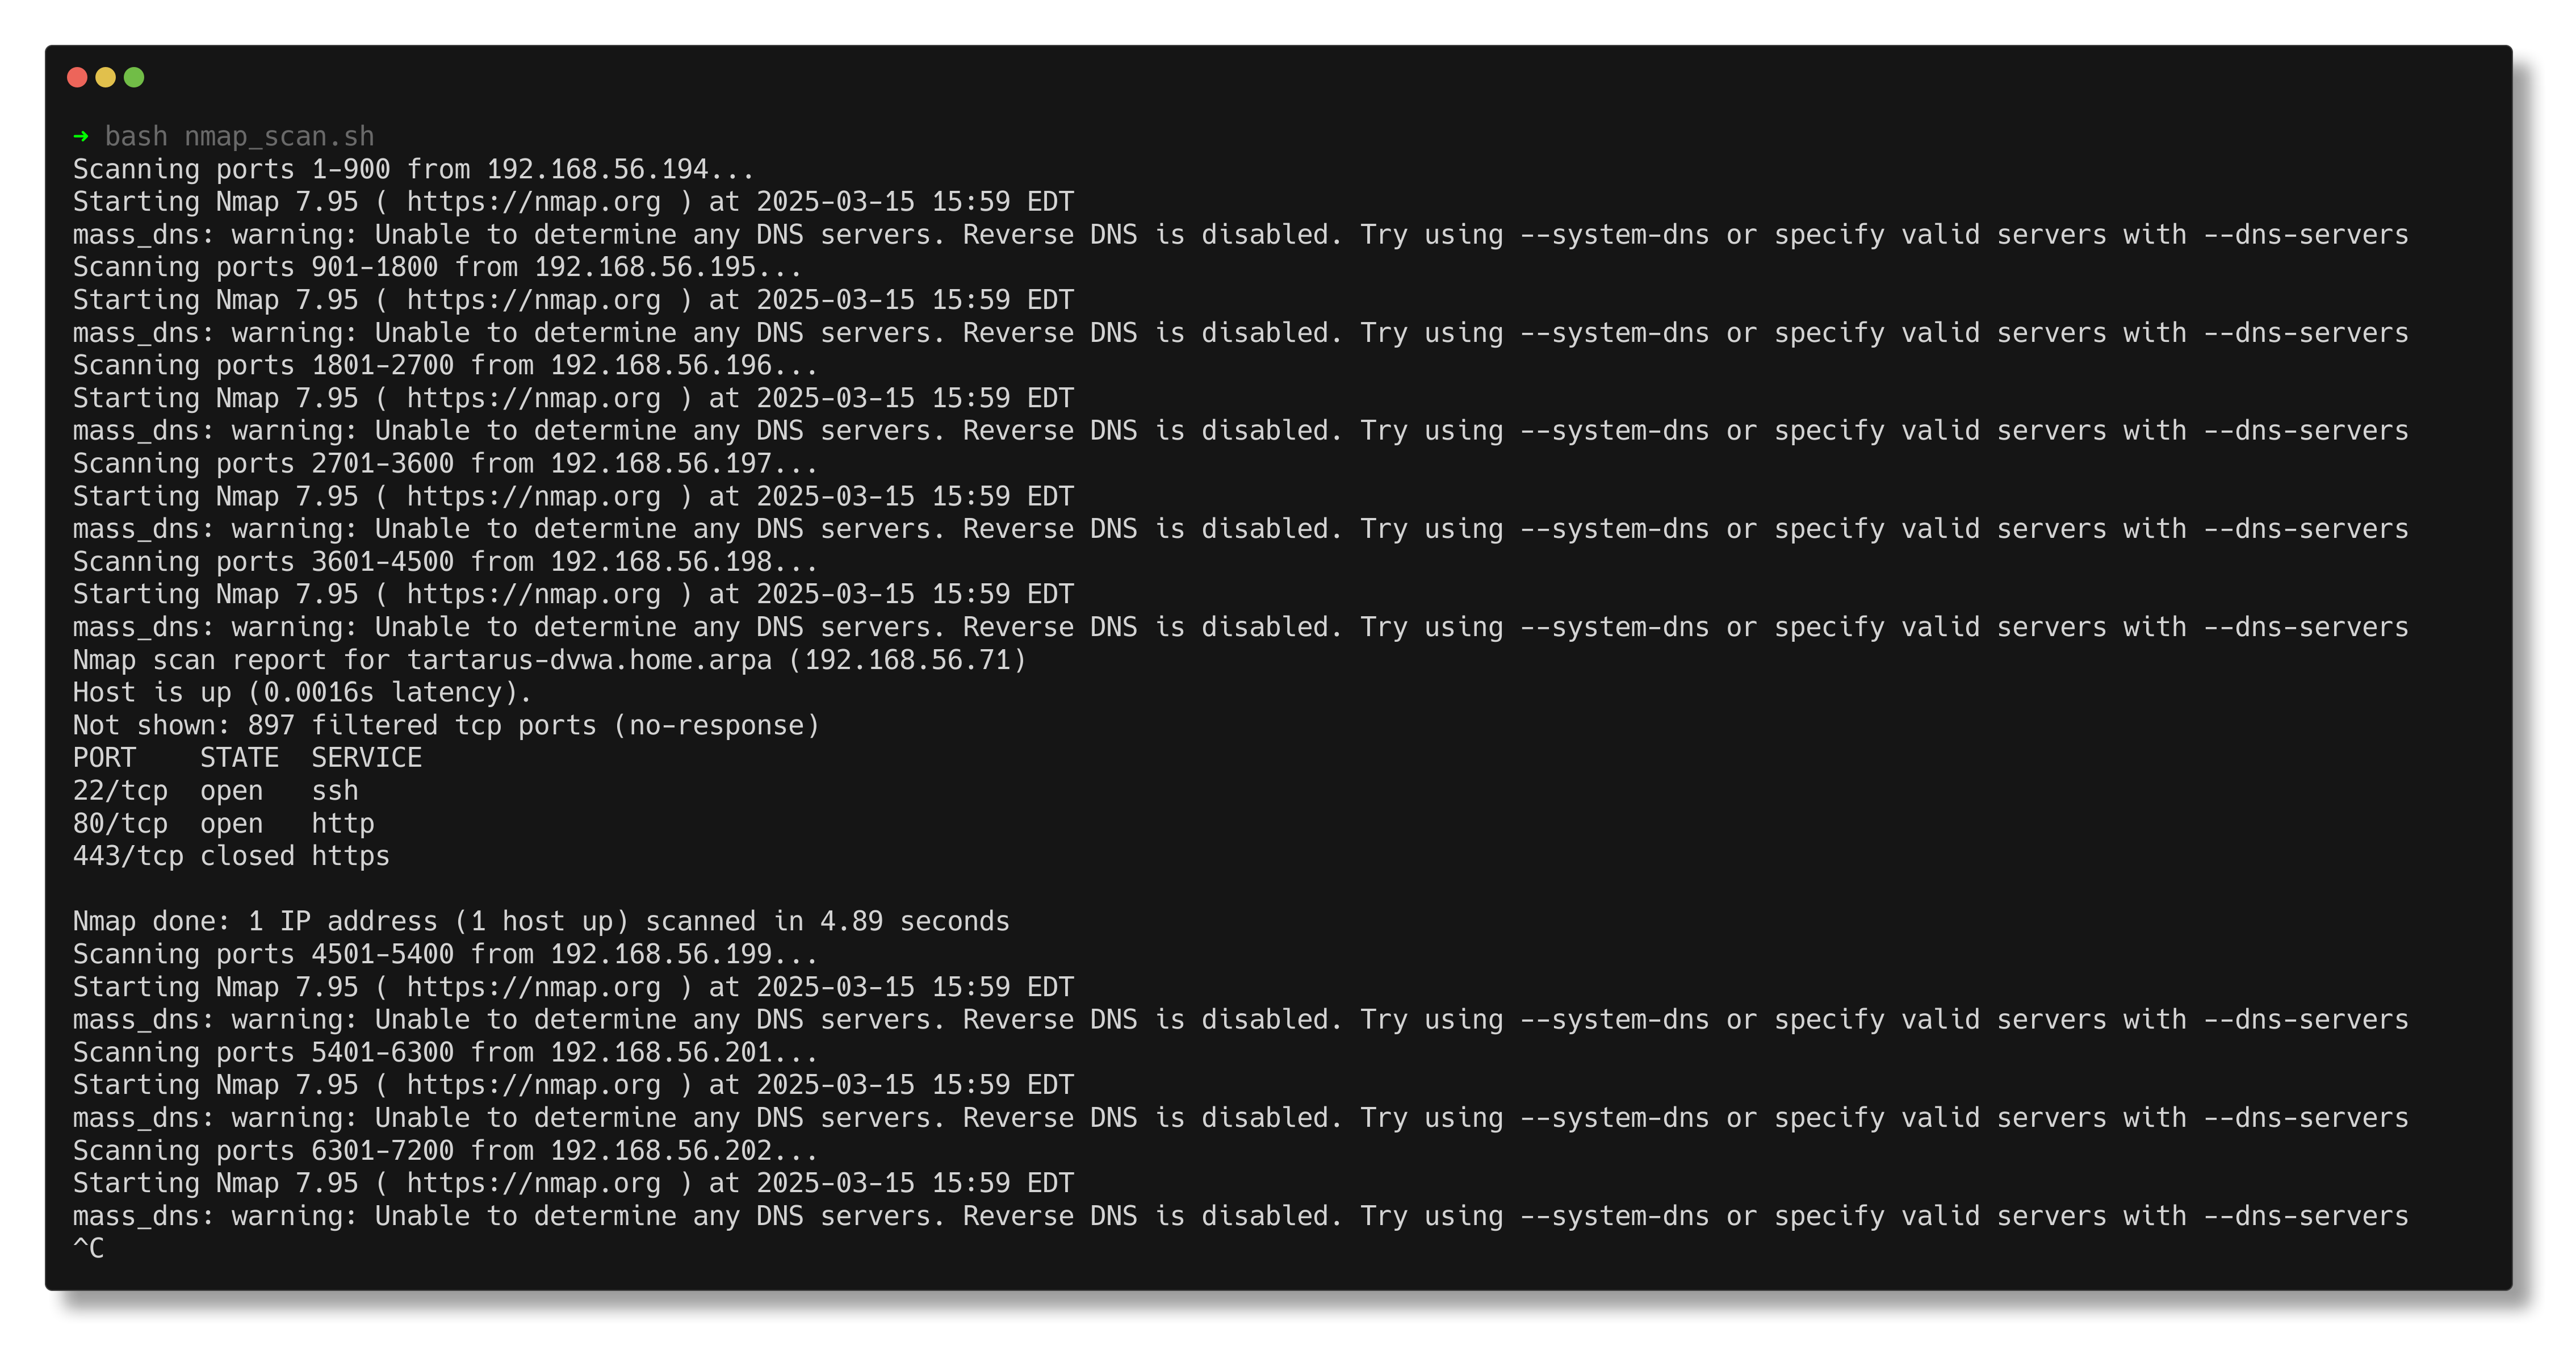 Example nmap scan script multiple source addresses
If we use the 1000 unique port example.
 Example kibana output using multi source ip scan
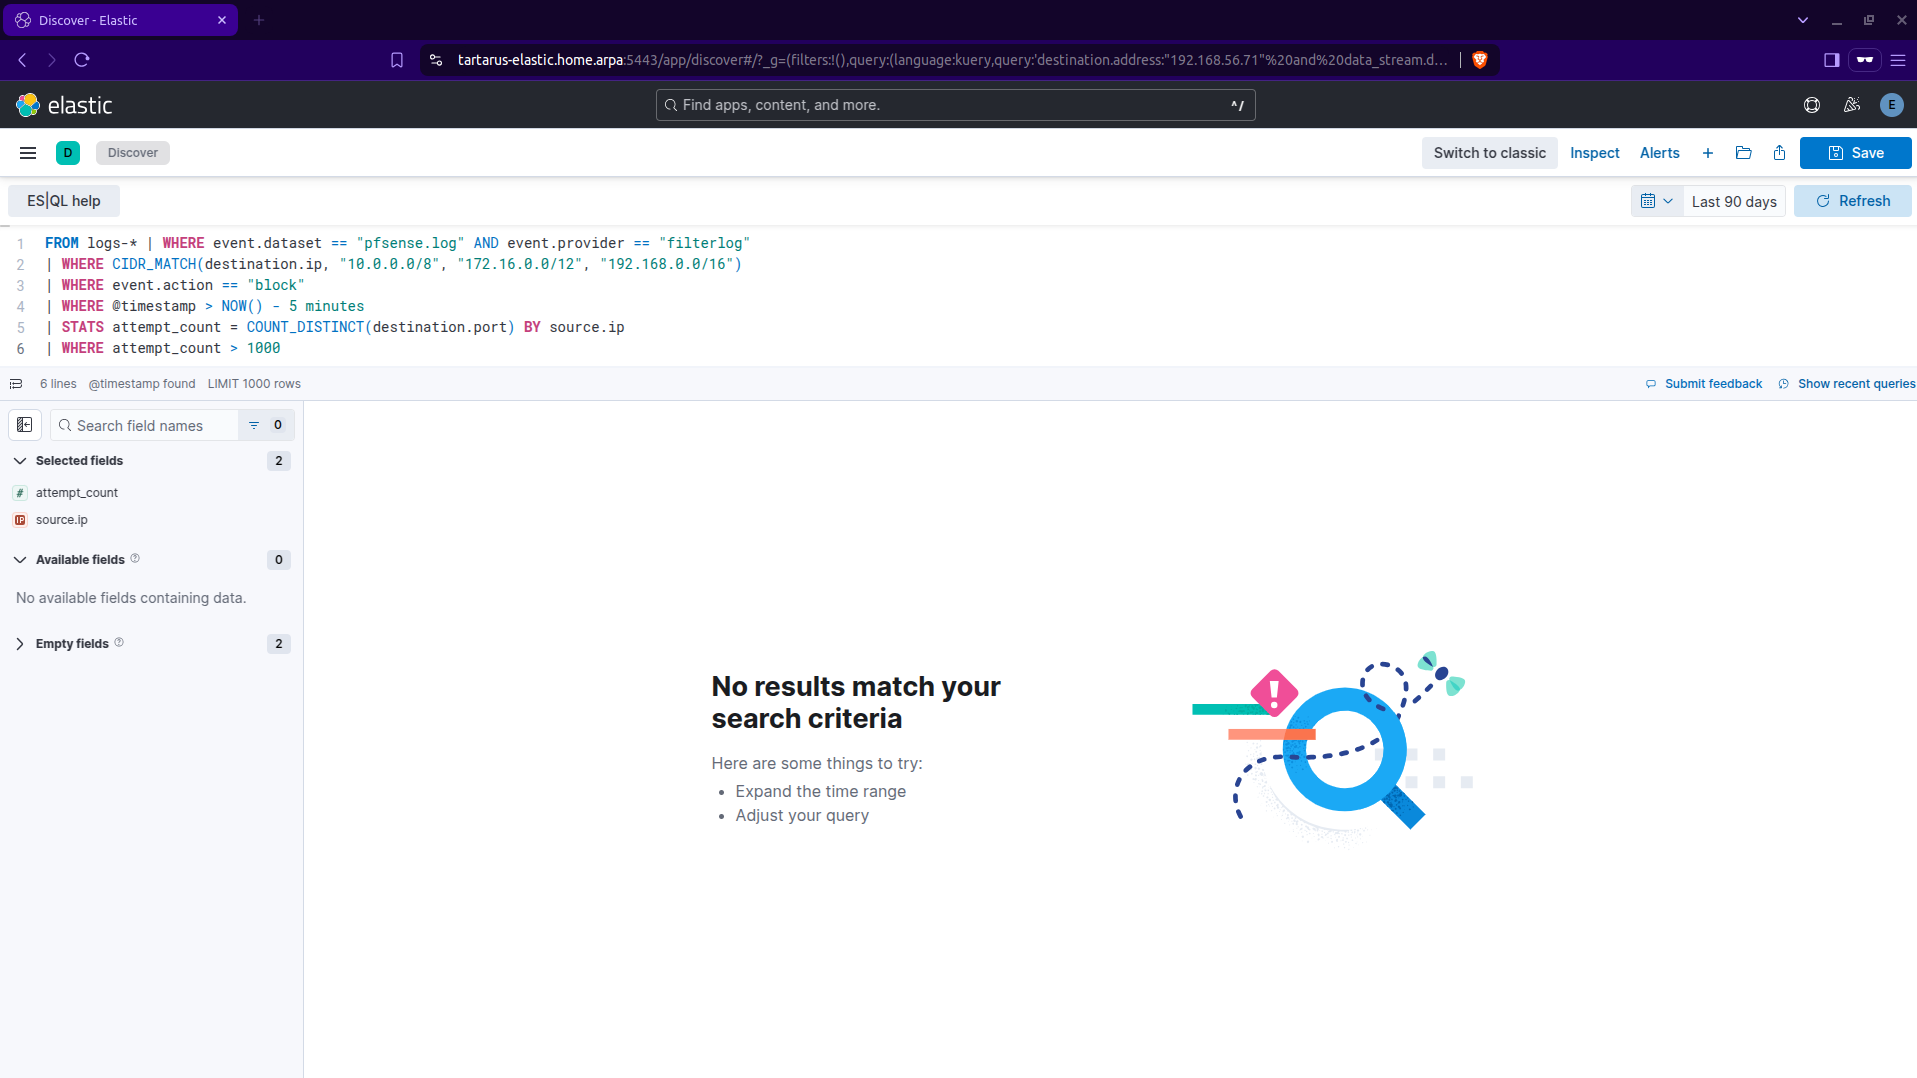
Now if we reduce the amount of ports per scan to 100 we get something:
1
2
3
4
5
6
FROM logs-* | WHERE event.dataset == "pfsense.log" AND event.provider == "filterlog"
| WHERE CIDR_MATCH(destination.ip, "10.0.0.0/8", "172.16.0.0/12", "192.168.0.0/16")
| WHERE event.action == "block"
| WHERE @timestamp > NOW() - 5 minutes
| STATS attempt_count = COUNT_DISTINCT(destination.port) BY source.ip
| WHERE attempt_count > 100
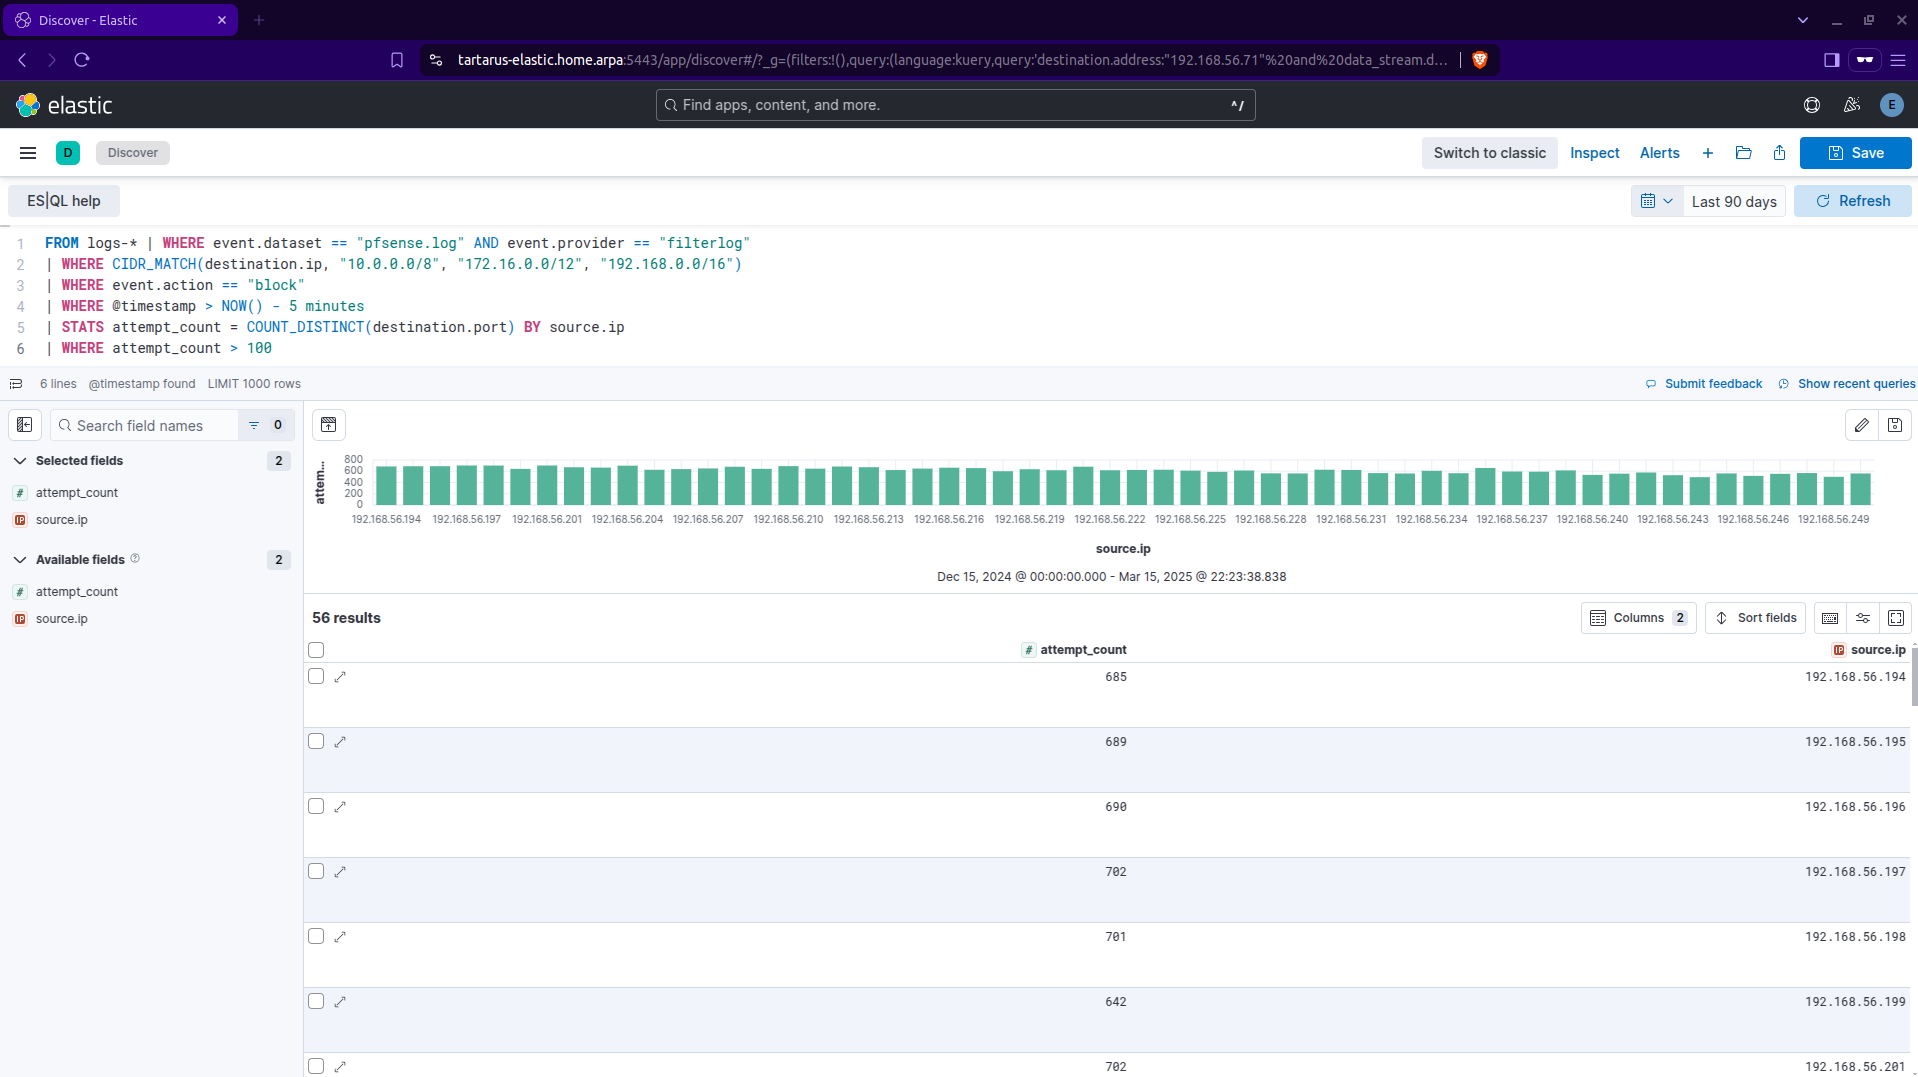 Example kibana output using a lower unique port count per source ip address
Don’t forget to delete the static interface we created and go back to
eth1
This will scan a good chunk of all 65,535 TCP ports, 900 ports at a time. Again this is just to demonstrate, if you had lets say 100,000 ProxyChains to scan from, less than one port per host would be needed, so as a Blue Team would need to cluster these scans, assuming they are doing recon against WAN infra. But we are down a rabbit hole!
The answer is to run periodic retro hunts looking for such activity (don’t forget to change the time window as well, near refresh button):
1
2
3
4
5
6
7
FROM logs-* | WHERE event.dataset == "pfsense.log" AND event.provider == "filterlog"
| WHERE CIDR_MATCH(destination.ip, "10.0.0.0/8", "172.16.0.0/12", "192.168.0.0/16")
| WHERE event.action == "block"
| WHERE @timestamp > NOW() - 1 month
| STATS attempt_count = COUNT_DISTINCT(destination.port) BY source.ip
| SORT attempt_count DESC
| WHERE attempt_count > 100
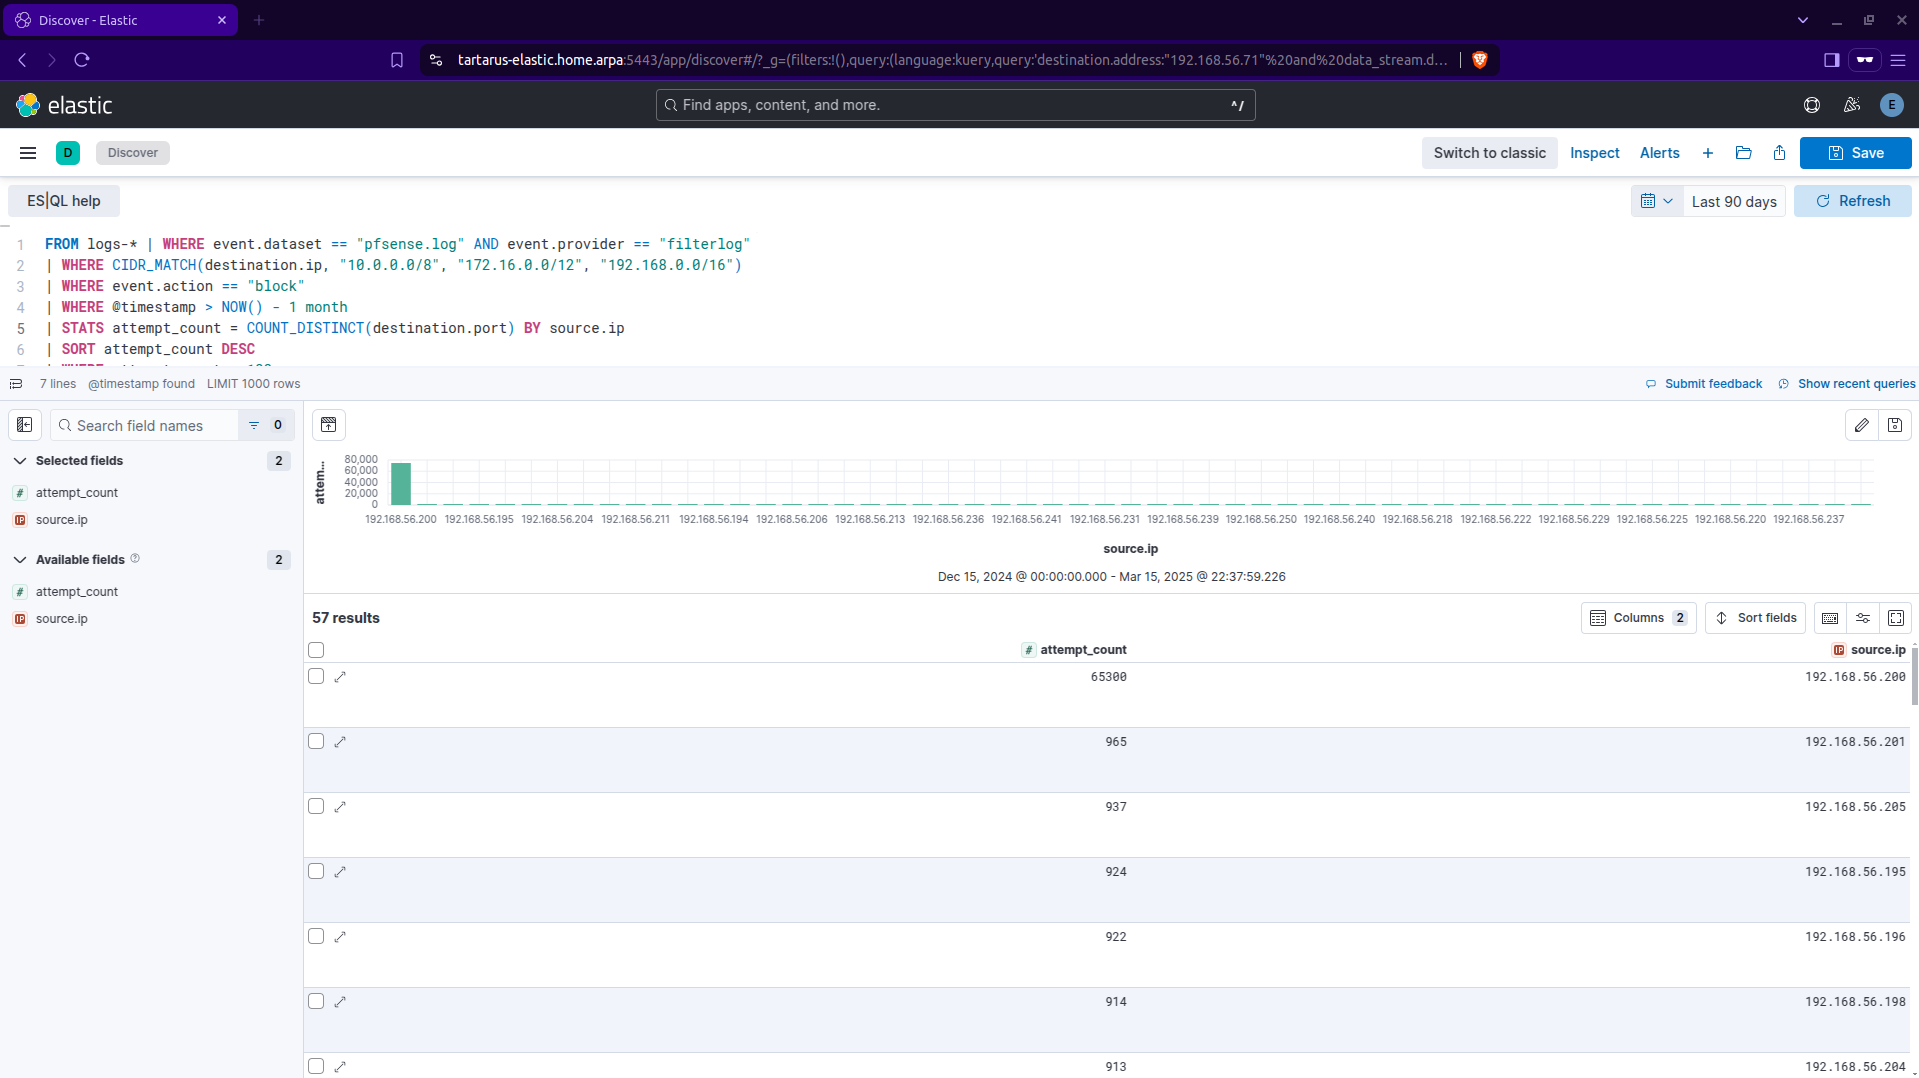 Example kibana es ql retro hunt type search for nmap scans
In the High Security post we can have a look at Suricata and play a little cat and mouse game, with much more advanced obfuscations.
ffuf
With a better understanding of what we are dealing with we could obfuscate how we formulate the web requests scanning the target. We will again be using ffuf.
First we must install the seclists with a little:
1
sudo apt install seclists
You must have an up to date distro!
If you are NOT using the Tartarus Lab add the DVWA node to your Kali guests’ hosts file:
Now also install pencode
1
go install github.com/ffuf/pencode/cmd/pencode@latest
We will modify what HTTP method we use to scan. First lets get a list of available methods with nmap:
1
sudo nmap -Pn -T1 -p80 -sV -sC --script-args http.useragent="Mozilla/5.0 (Windows NT 10.0; Win64; x64) AppleWebKit/537.36 (KHTML, like Gecko) Chrome/101.0.4951.61 Safari/537.36" -vv tartarus-dvwa.home.arpa
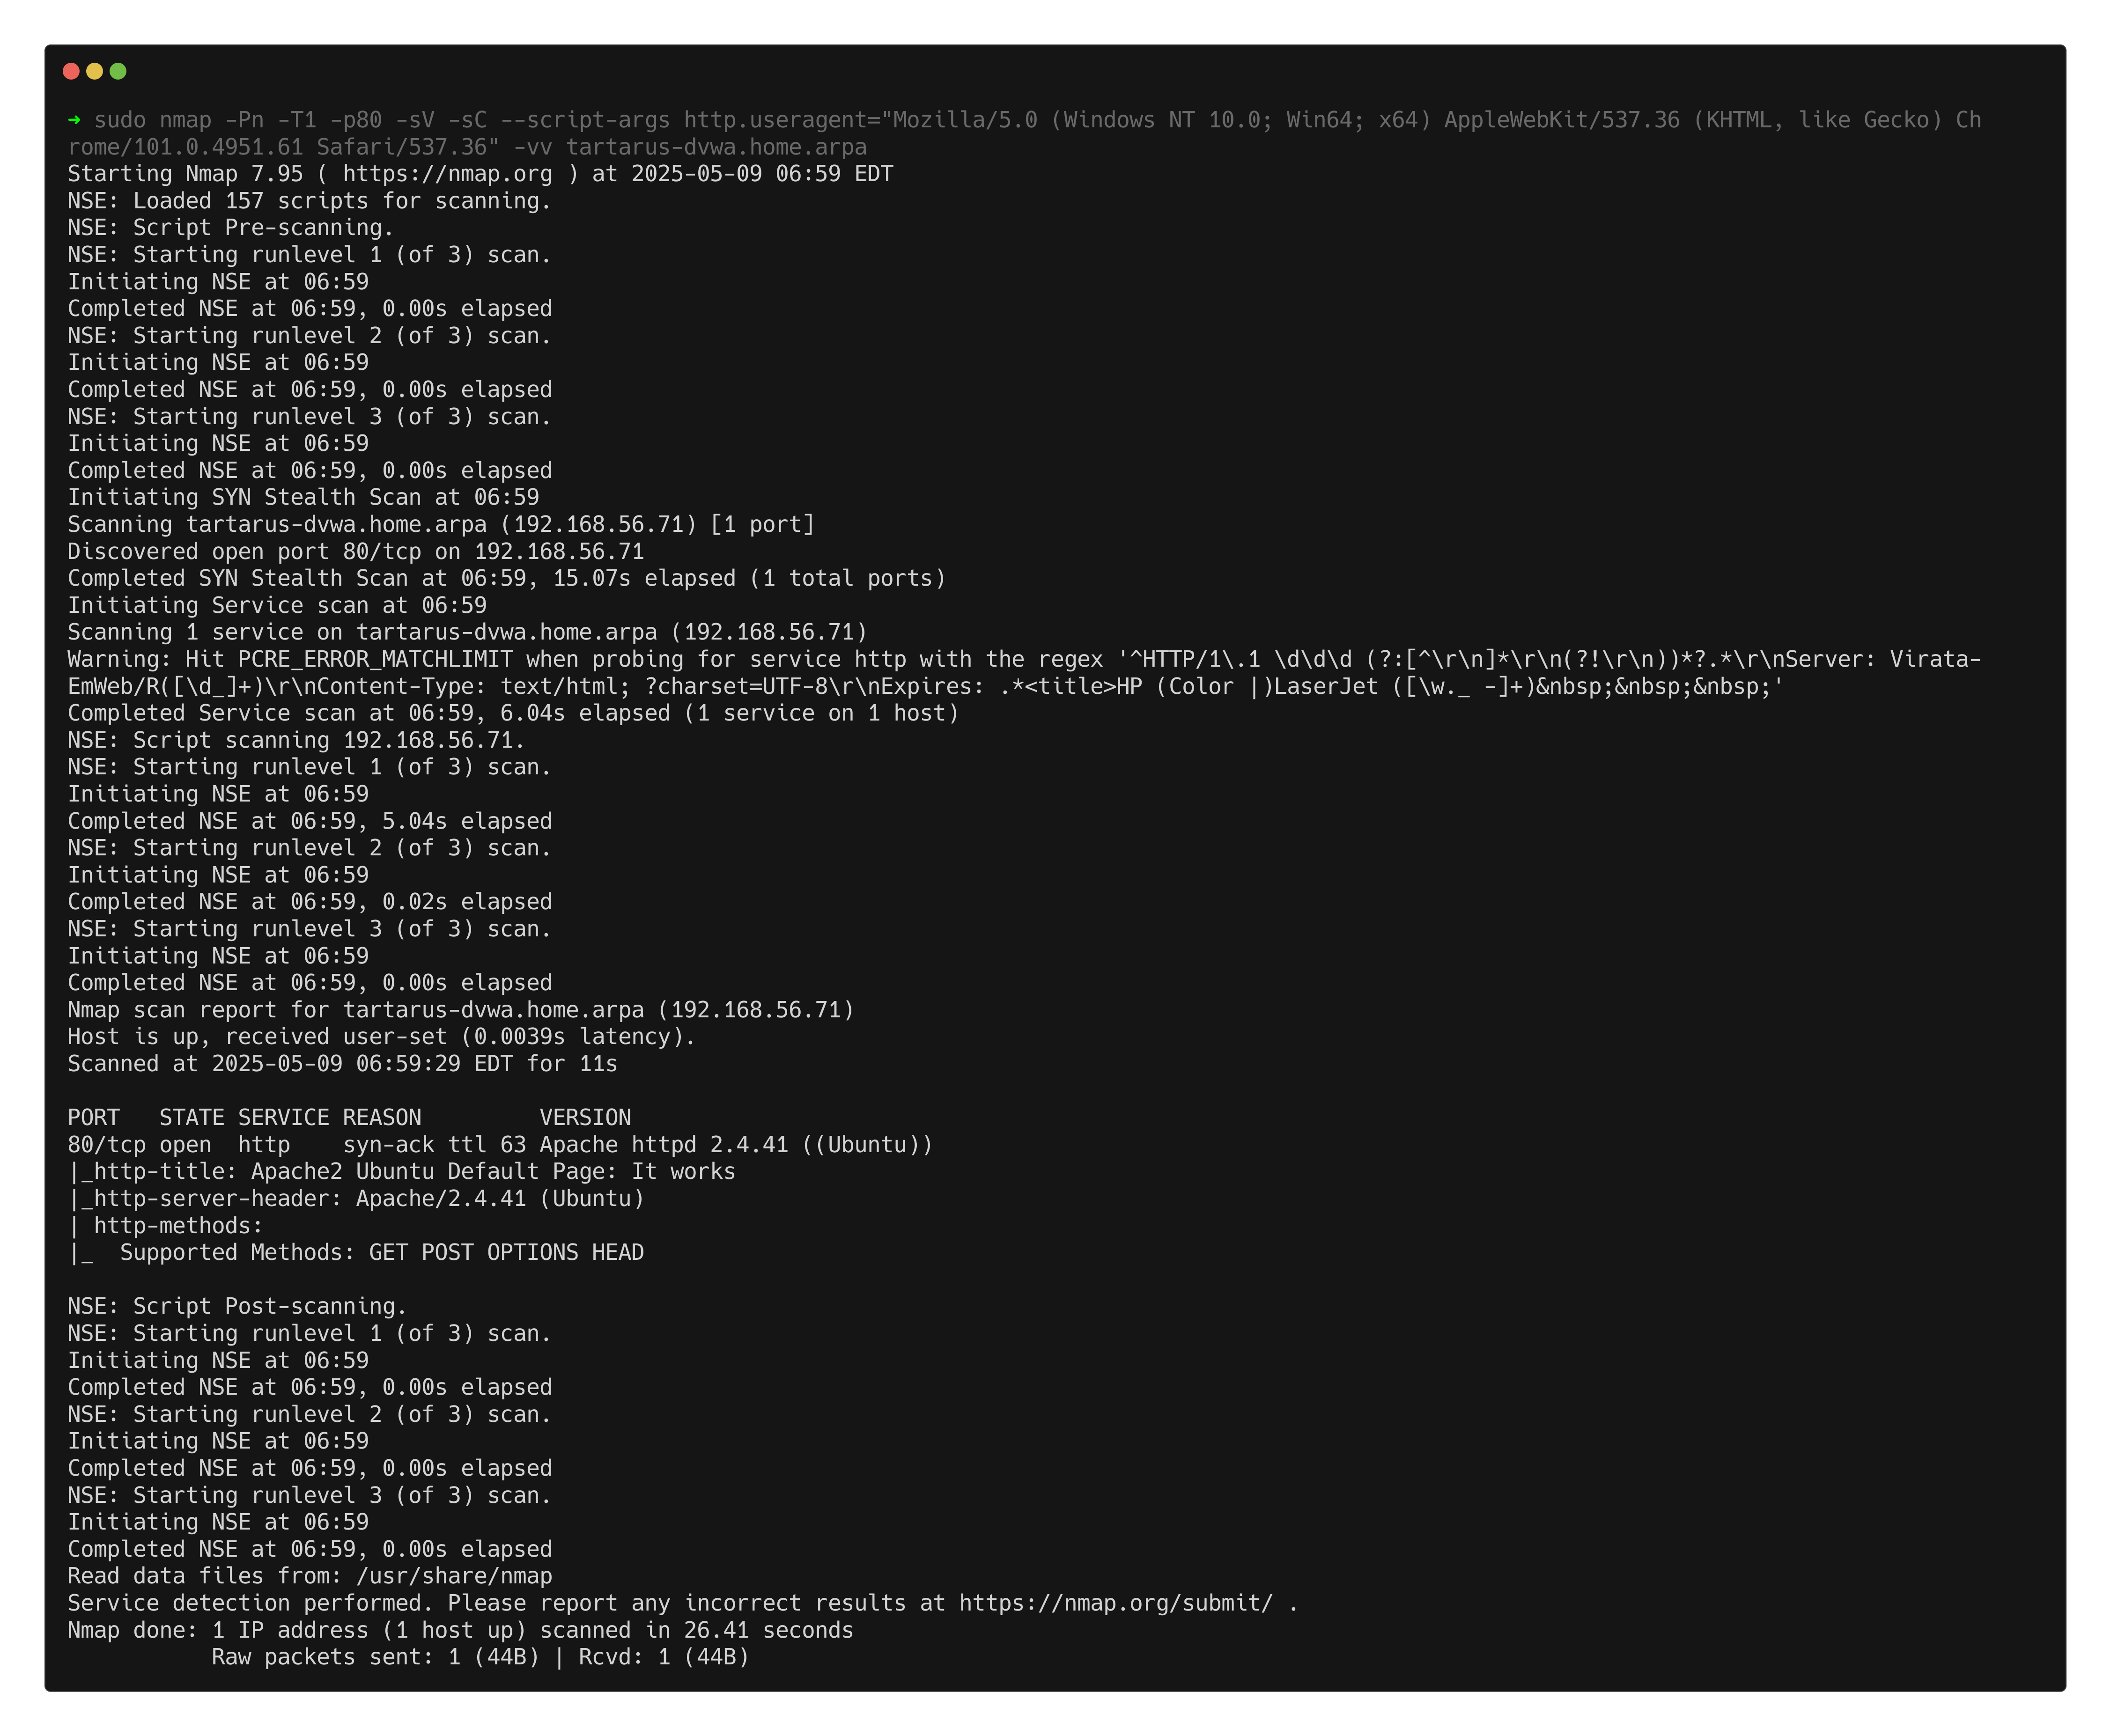 Example nmap scan to get available methods on port 80
We can use GET, POST, OPTIONS and HEAD; today we will focus on the HEAD method.
Having a look at the RFC to get some inspiration for how to obfuscate the web recon, we can see HEAD should behave exactly like GET except it “MUST NOT” return any message-body. Interesting.
The rules we are trying to subvert are:
- Web Apache Correlation Hack Tool User Agent
- Web Apache Correlation Directory Enumeration
1
ffuf -X HEAD -u "http://tartarus-dvwa.home.arpa/FUZZ" -H "User-Agent: Mozilla/5.0 (Windows NT 10.0; Win64; x64) AppleWebKit/537.36 (KHTML, like Gecko) Chrome/132.0.0.0 Safari/537.3" -mc 200 -r -w <(pencode -input /usr/share/wordlists/seclists/Fuzzing/1-4_all_letters_a-z.txt upper)
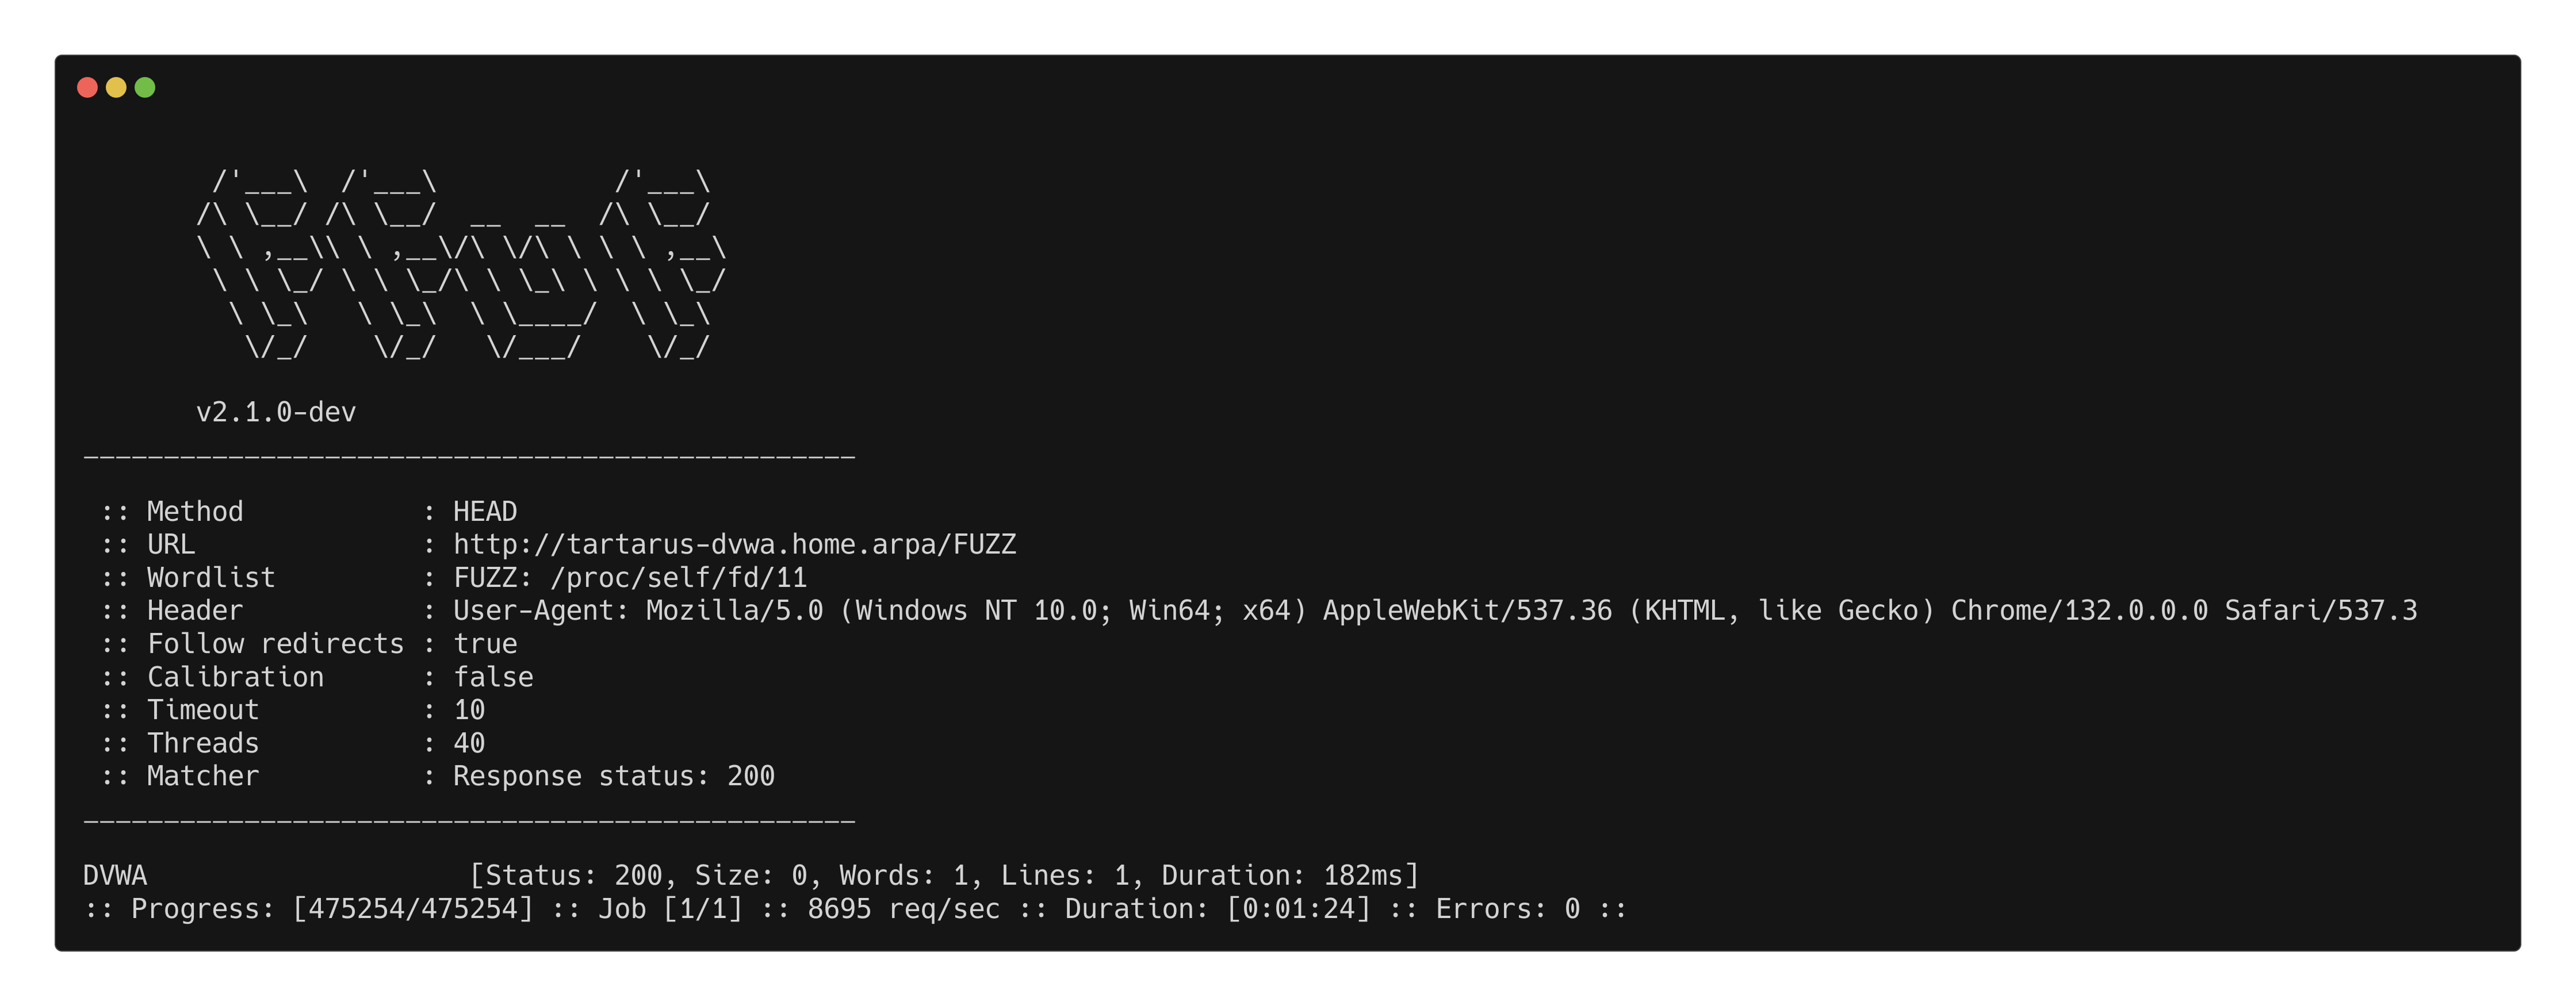 Example ffuf using the head method
What does the SIEM look like after sending half a million requests in under 90 seconds. :)
Why use the HEAD method instead of GET? Good question, some detection logic presupposes that only the GET method can be used to obtain information from the target, meaning it’s used as poor way to filter activity. Like the Sigma rule created in the last blog post. Without adjusting the time factor you should always look to alter the rules of the game itself to your advantage.
Now that we know the target directory lets “log in”. :)
Side Channel: Main page ‘undocumented’ login exploit
You would notice when trying to log into the main login page after some time, it will trow an error regarding the CSRF token:
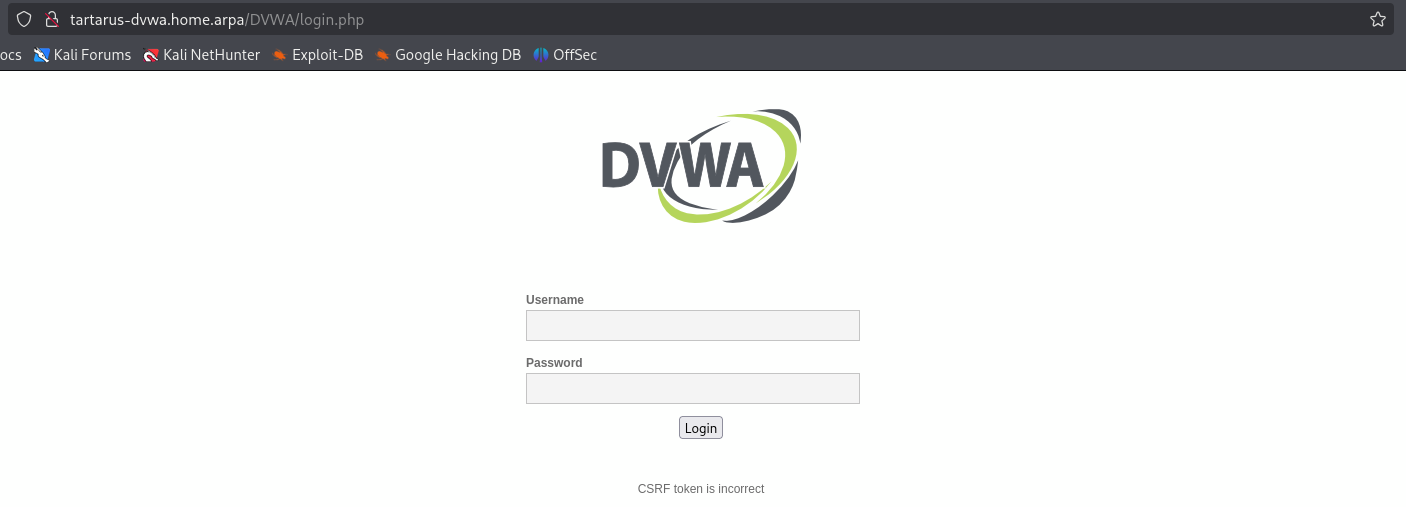 Example main login page csrf error
If you attempt to hydra the login page you will be greeted with “success”:
1
curl -s -c cookies.txt "http://tartarus-dvwa.home.arpa/DVWA/login.php" | grep -Eo "name='user_token' value='[^']*'" | cut -d"'" -f4 | grep -Eo [a-zA-Z0-9+]{32} | xargs -I {} hydra -I tartarus-dvwa.home.arpa -l admin -P /usr/share/wordlists/rockyou.txt http-post-form "/DVWA/login.php:username=^USER^&password=^PASS^&Login=Login&user_token={}:Login failed"
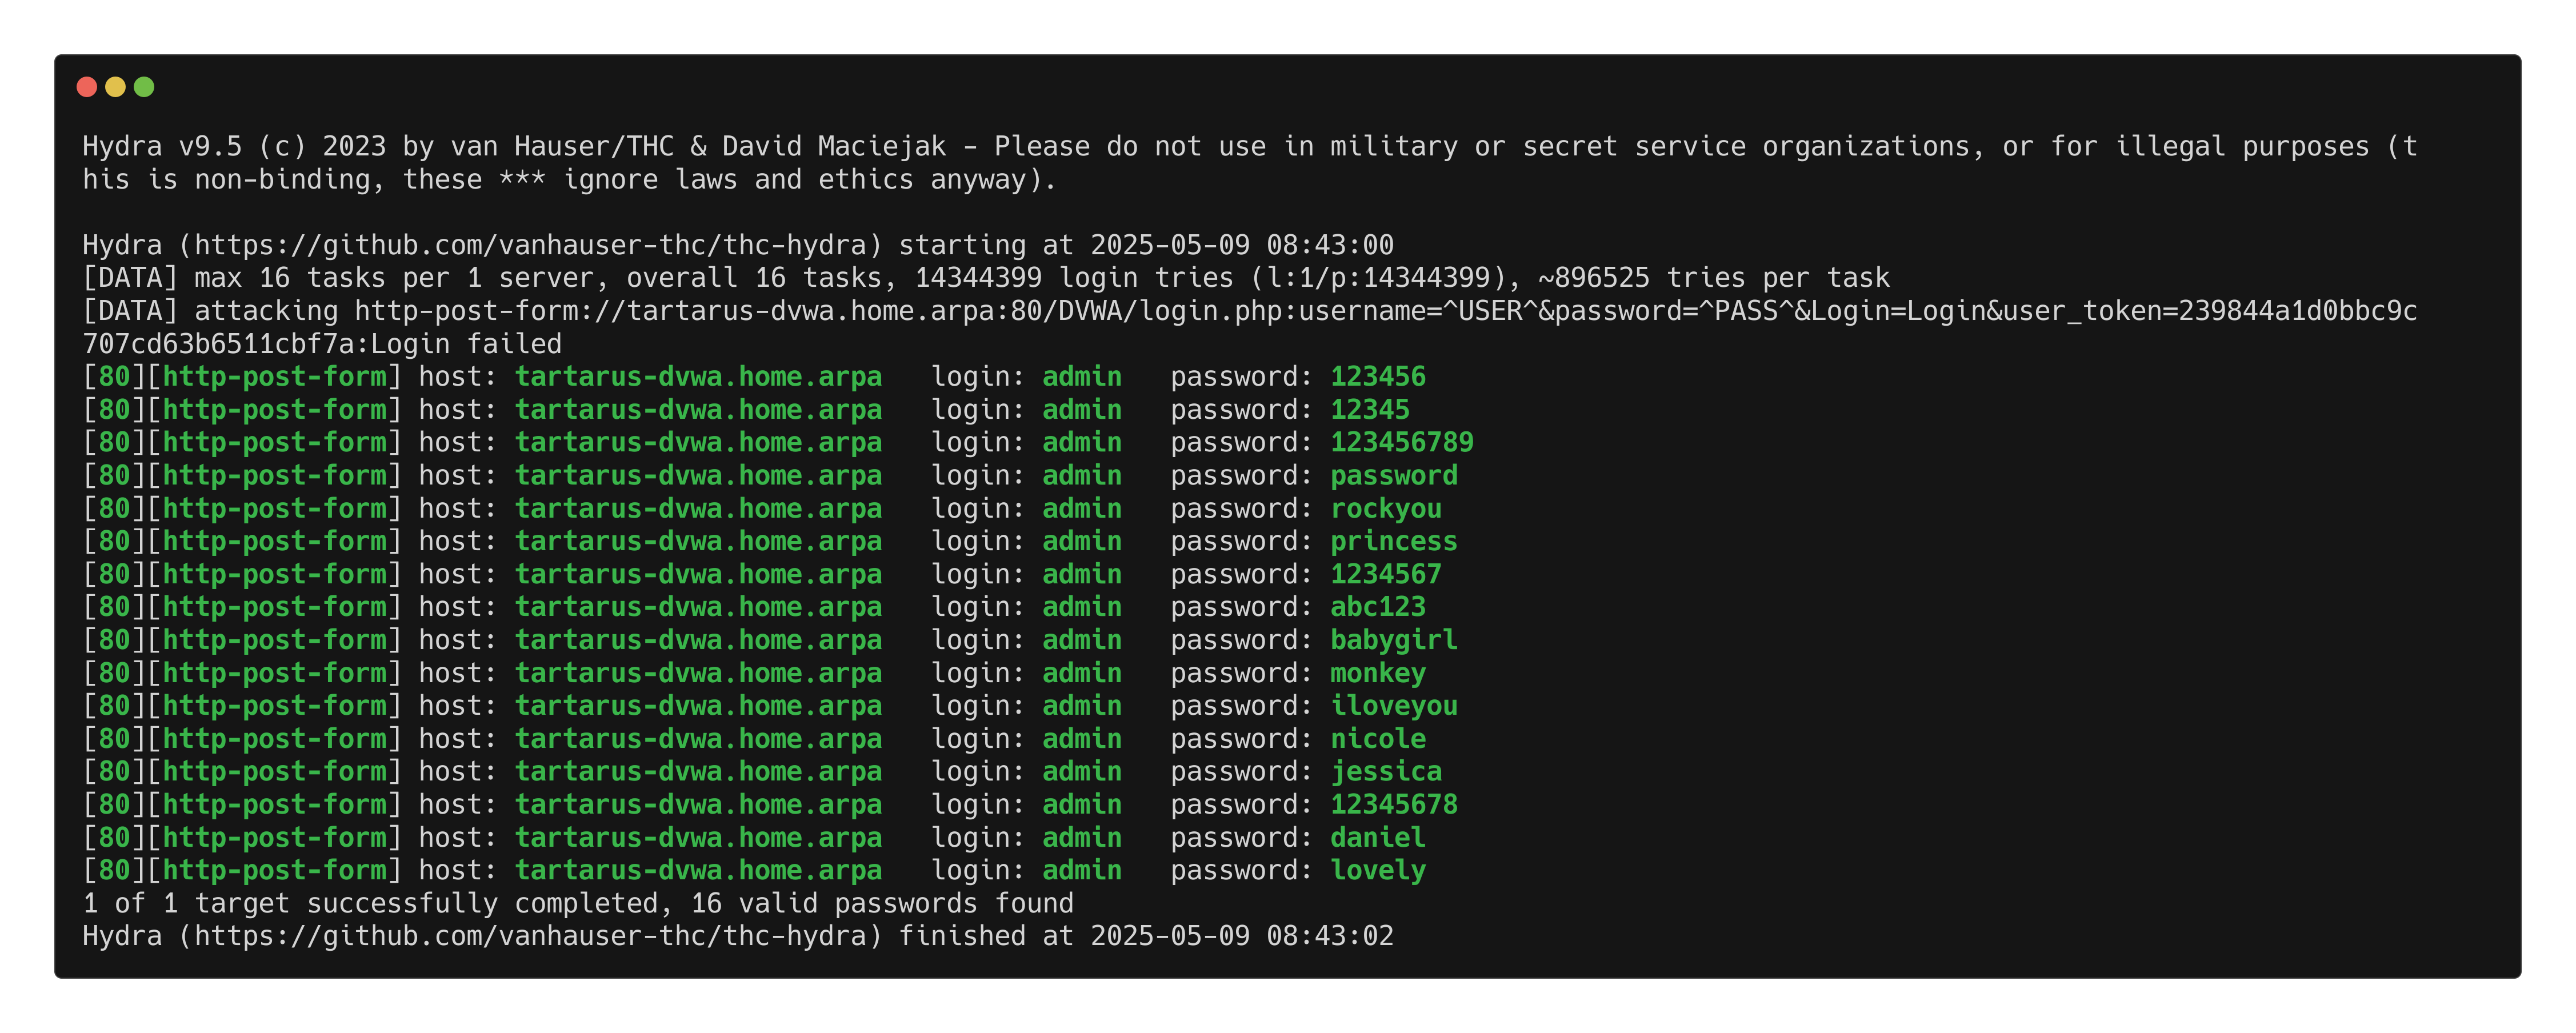 Example hydra attempt against the main login page
The reason is the page doesn’t have “Login failed” instead it has the CSRF error, if you try login with invalid tokens. You can confirm this if you open up two browser windows and attempt to login with the CSRF token from the first on the second:
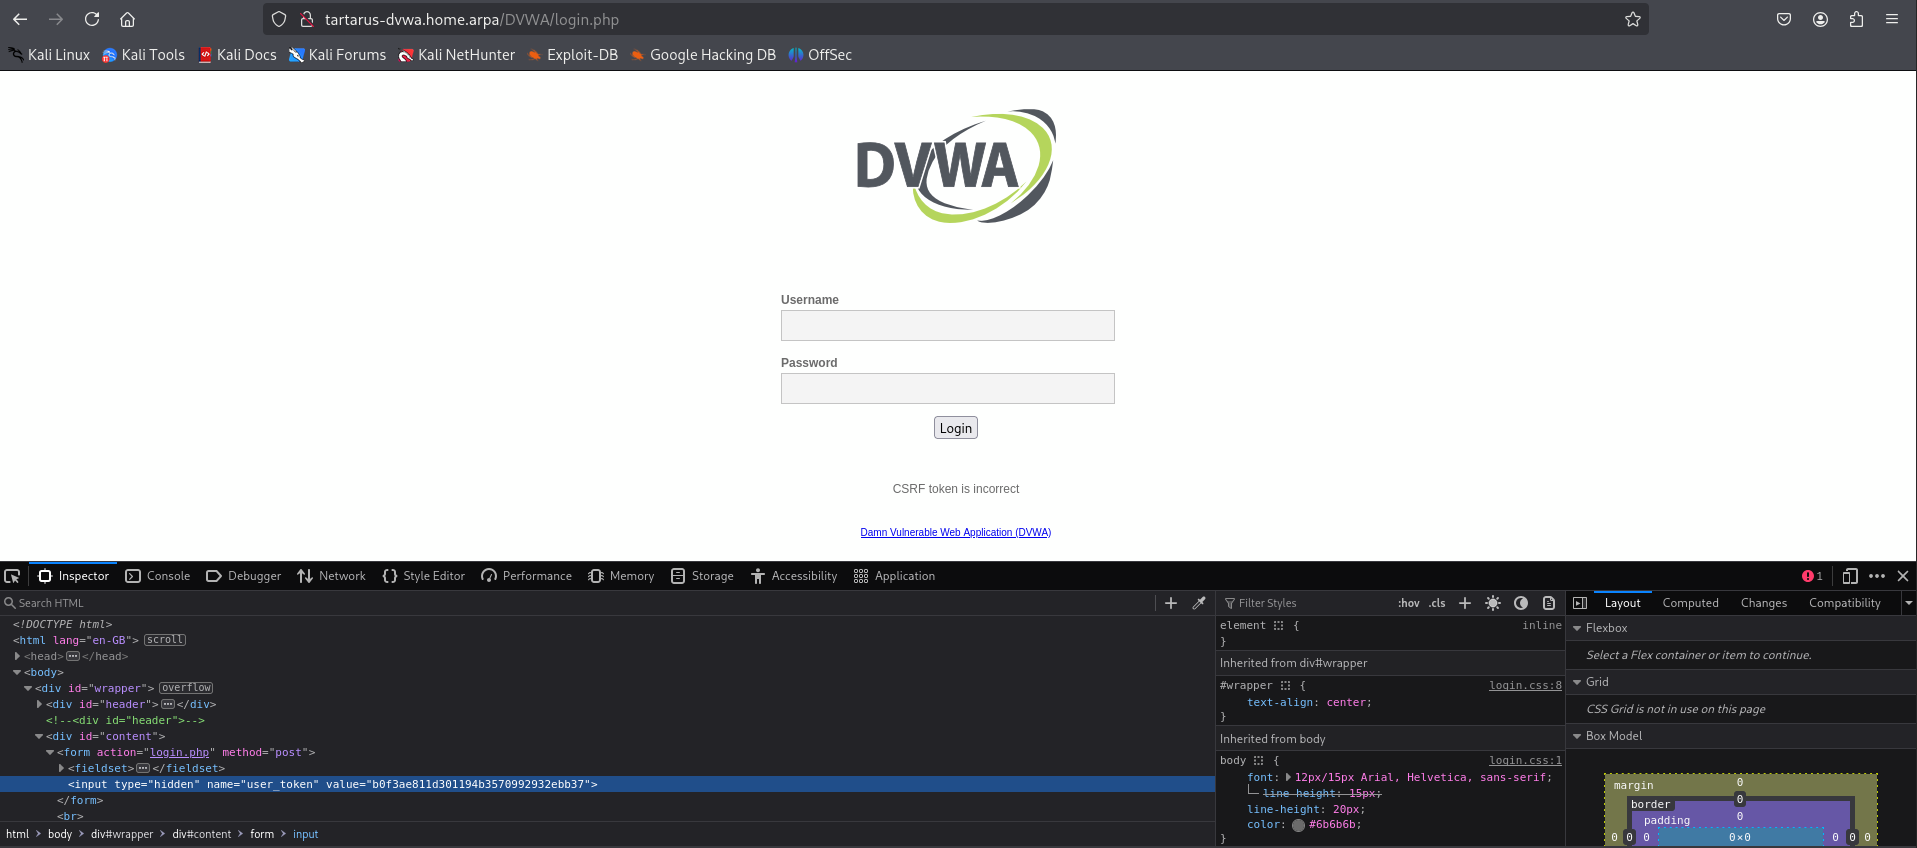 Example csrf error
So what does this all mean? What if we - like I discovered in the first Low Sec post - just not pass a CSRF token with our POST requests? The requests don’t follow the normal flow of how the the application expects them to happen:
sequenceDiagram
    participant Attacker
    participant DVWA_Server

    %% Step 1: Authenticate and get PHPSESSID and user_token
    Attacker->>DVWA_Server: GET /DVWA/login.php
    DVWA_Server-->>Attacker: Login Page with user_token

    Attacker->>DVWA_Server: POST /DVWA/login.php (username, password, user_token)
    DVWA_Server-->>Attacker: Response with PHPSESSID
Instead how the nuclei template does:
sequenceDiagram
    participant Attacker
    participant DVWA_Server

    %% Step 1: Authenticate and get PHPSESSID and user_token
    Attacker->>DVWA_Server: POST /DVWA/login.php (username, password)
    DVWA_Server-->>Attacker: Response with PHPSESSID
I’ve written a nuclei template to demonstrate this. DVWA Brute Force - Mian Login - CSRF Bypass
Just to exemplify the principle, IRL you’d use a real wordlist.
1
nuclei -u http://tartarus-dvwa.home.arpa/DVWA -t /vagrant/nuclei-templates/dvwa/dvwa-brute-force-main-login-csrf-bypass.yaml
 Example nuclei csrf main login bypass
If you use one of the PHPSESSID to login via a browser you will find something strange (Log in with any of the users, do an inspect element, in the storage/application tab replace the cookie with one from the list):
 Example login from a session cookie using main page csrf bypass
As we know currently there is no detection for POST request based activity, so lets fix that in the Blue Team section!
Recon Medium Sec - Blue Team
We are presented with a challenge, how do we create rule logic to identify the obfuscated activity - while reducing or maintaining the total volume of alerts? With regards to the Nmap scanning obfuscations there isn’t much to be done, the pfSense Port Scan rule has a Threat Hunt mode that relaxes the detection criterion. For the HEAD based recon it’s as simple as removing the GET method constraint from the Directory Enum Sigma rule.
Not all servers or services are created equal, an external AWS web server is expected to be constantly hit by just about everyone and their grandmother! Critical internal servers like Active Directory, Backup Servers, DNS, Artifactories, Vulnerability Scanners, Jumpboxes, CI/CD infra, should be treated differently - any recon activity against these High Value Targets must be monitored. What happens when the Threat Actor infiltrates your AD or Vuln Scanner? For example they own an AD server, they would have a much easier time escalating to Domain Admin. Or they are sitting inside your Vuln Scanner, it would be trivial to use the escalated access and expected malicious traffic to blend right in and be almost invisible while pivoting throughout your infrastructure.
What about the “Undocumented” main login page exploit? How do we detect POST based brute force attempts? As I see it, there are two schools of thought, write better logging polices into the applications themselves, or use a reverse proxy to intercept and monitor the request body. Modifying all production code to log better (for now, who knows what the requirements might be in future) is a non-starter, however new services should include robust logging polices. We are left with proxying the connections and monitoring traffic “on the wire”, this is a better approach for quick wins. There are naturally tradeoffs, namely now we must manage and administer more infrastructure (more code, more bugs!). The benefits outweigh the costs in this instance. We will install ModSecurity Audit, this will allow us to intercept HTTP requests and observe the POST request message body.
In the real world you’ll want to look at alternatives like Coraza WAF, however they log a bit differently to the default way Elastic’s parser expects. I won’t be writing a new parser just for the memes at the moment.
Install ModSecurity
First things first, we will need to manually install and configure the ModSecurity package onto the Ubuntu DVWA guest (Boo no automation!), with your own Tartarus lab you can easily add it to the install scripts for the Ubuntu guest, however the main repo won’t have it as part of the default deployment scripts. Luckily you only need to do this once, if you don’t vagrant destroy the Ubuntu guest!
Log into the Ubuntu guest with the following command in the directory you ran vagrant up from:
1
vagrant ssh dvwa
Once inside the guest we must update the package list:
1
sudo apt update
We won’t be installing ModSecurity v3 yet, it has issues and everything must be built from source, instead we will install ModSecurity 2.9 with the package manager:
1
sudo apt install libapache2-mod-security2
Now restart Apache to make sure the installation succeeded:
1
sudo systemctl restart apache2
You can get the status of the service you just restarted in two ways:
1
sudo systemctl status apache2
OR
1
^restart^status
The caret (^) method uses the Bash history to replace the left-hand word in the last command you ran with the right-hand word, very useful! But it must come directly after the command you want to substitute! And very easy to mess things up so be careful!
Now we must configure ModSecurity:
1
sudo cp /etc/modsecurity/modsecurity.conf-recommended /etc/modsecurity/modsecurity.conf
We will enable the engine and make the recommended config changes:
1
2
3
4
5
sudo sed -i 's/DetectionOnly/On/' /etc/modsecurity/modsecurity.conf
sudo sed -i 's/SecAuditLogParts [A-Z]\+/SecAuditLogParts ABDEFHIJZ/g' /etc/modsecurity/modsecurity.conf
sudo sed -i 's/SecAuditLogType [A-Za-z]\+/SecAuditLogType Serial/g' /etc/modsecurity/modsecurity.conf
sudo sed -i 's|^SecAuditLog .*|SecAuditLog /var/log/modsec_audit.json|' /etc/modsecurity/modsecurity.conf
sudo bash -c  "echo 'SecAuditLogFormat JSON' >> /etc/modsecurity/modsecurity.conf"
Restart Apache again and confirm its still running:
1
sudo systemctl restart apache2
1
sudo systemctl status apache2
We will first create the directory that’ll house our custom rules and copy them over:
1
2
sudo mkdir /etc/modsecurity/custom_rules
sudo cp /vagrant/modsecurity/*.conf /etc/modsecurity/custom_rules/
Next we will download the OWASP Core Rule Set (This is the previous major release):
1
2
wget https://github.com/coreruleset/coreruleset/releases/download/v3.3.7/coreruleset-3.3.7-minimal.tar.gz
wget https://github.com/coreruleset/coreruleset/releases/download/v3.3.7/coreruleset-3.3.7-minimal.tar.gz.asc
Verify the GPG keys:
1
2
gpg --fetch-key https://coreruleset.org/security.asc
gpg --verify coreruleset-3.3.7-minimal.tar.gz.asc
You should see something like:
1
2
3
...
gpg: Good signature from "OWASP Core Rule Set <security@coreruleset.org>" [unknown]
...
Now we extract the archive:
1
tar xvf coreruleset-3.3.7-minimal.tar.gz
Move the ruleset file to /etc/:
1
sudo mv coreruleset-3.3.7/crs-setup.conf.example /etc/modsecurity/crs-setup.conf
And move the rules:
1
sudo mv coreruleset-3.3.7/rules/ /etc/modsecurity/
Now make sure the Apache mod file knows about the new config edit with your fav text editor to make the following file look like the below:
1
sudo vim /etc/apache2/mods-enabled/security2.conf
Make it look like:
1
2
3
4
5
6
<IfModule security2_module>
	SecDataDir /var/cache/modsecurity
	IncludeOptional /etc/modsecurity/*.conf
	Include /etc/modsecurity/rules/*.conf
	Include /etc/modsecurity/custom_rules/*.conf
</IfModule>
/etc/modsecurity/custom_rules/*.conf is where you must place the custom rules from the Git repo!
Now again we restart Apache:
1
sudo systemctl restart apache2
1
sudo systemctl status apache2
Your looking for:
1
2
3
...
     Active: active (running) since ...
...
If it’s dead then something has gone wrong and restart the install steps.
Now we test to make sure it’s working against the live DVWA. Login to the target and attempt a LFI on Low Sec.
On the Kali guest navigate to (once you’ve logged in and set the sec to low): http://tartarus-dvwa.home.arpa/DVWA/vulnerabilities/fi/?page=/etc/passwd
You will be greeted with a 403 Forbidden:
 Example modsec blocked request
Elastic add ModSecurity integration
Now we know that it’s working lets add it to the SIEM!
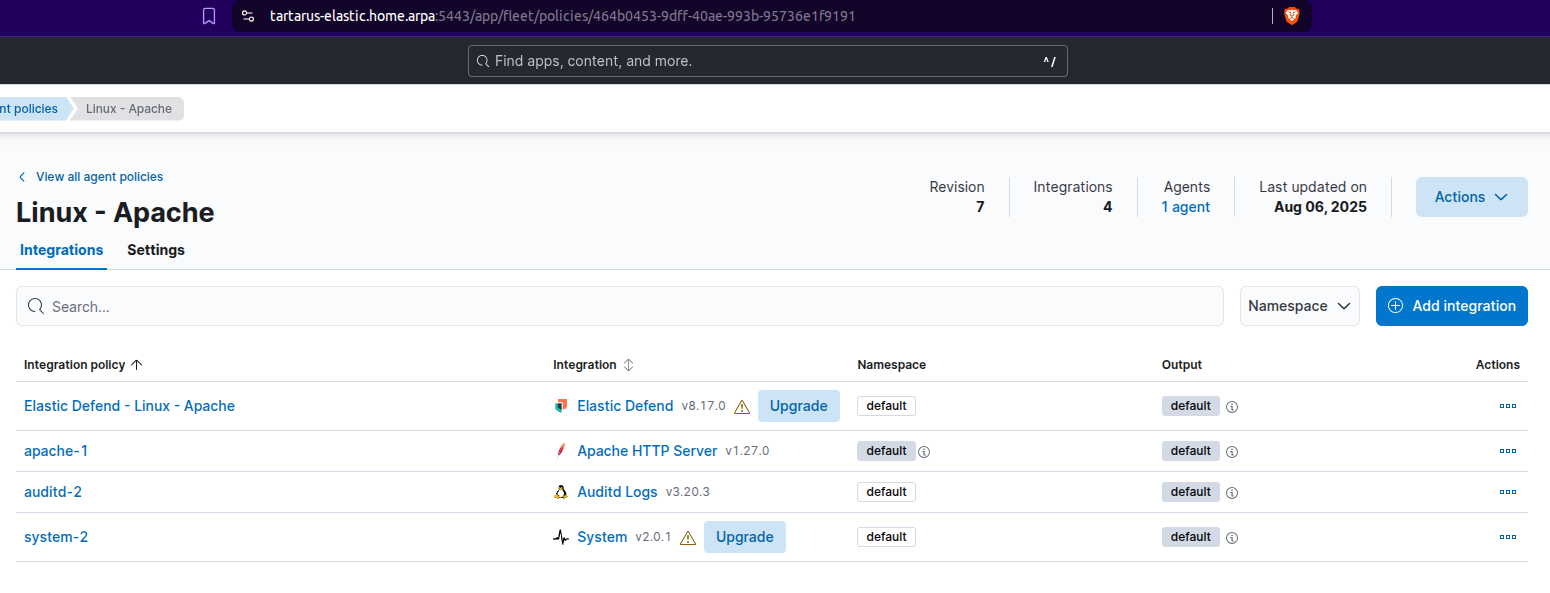
Log into the SIEM and navigate to the Fleet Agent Policies tab: https://tartarus-elastic.home.arpa:5443/app/fleet/policies
Select the “Linux - Apache” policy:
 Example elastic policy page
We will now add and integration to this policy, click on the “Add integration” button:
 Example add integration page
Search for “modsecurity” and click on the entry:
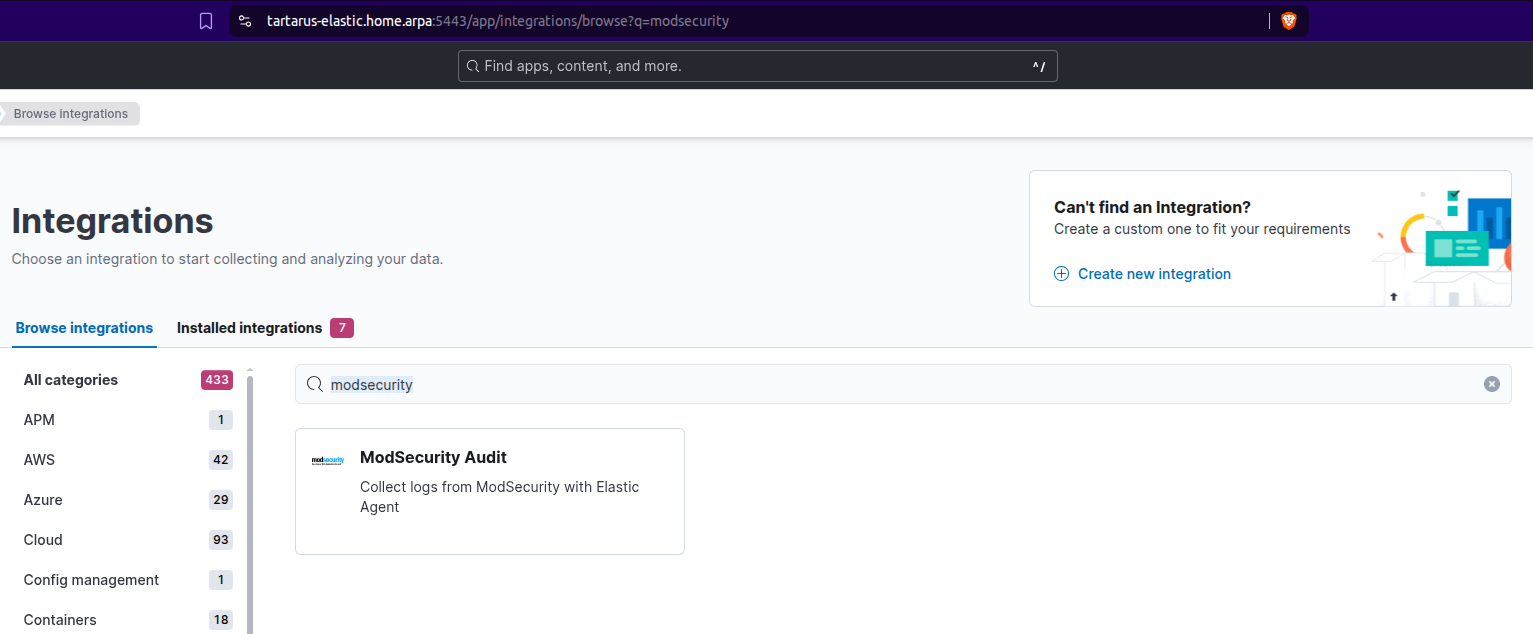 Example search
Click on “Add ModSecurity Audit”:
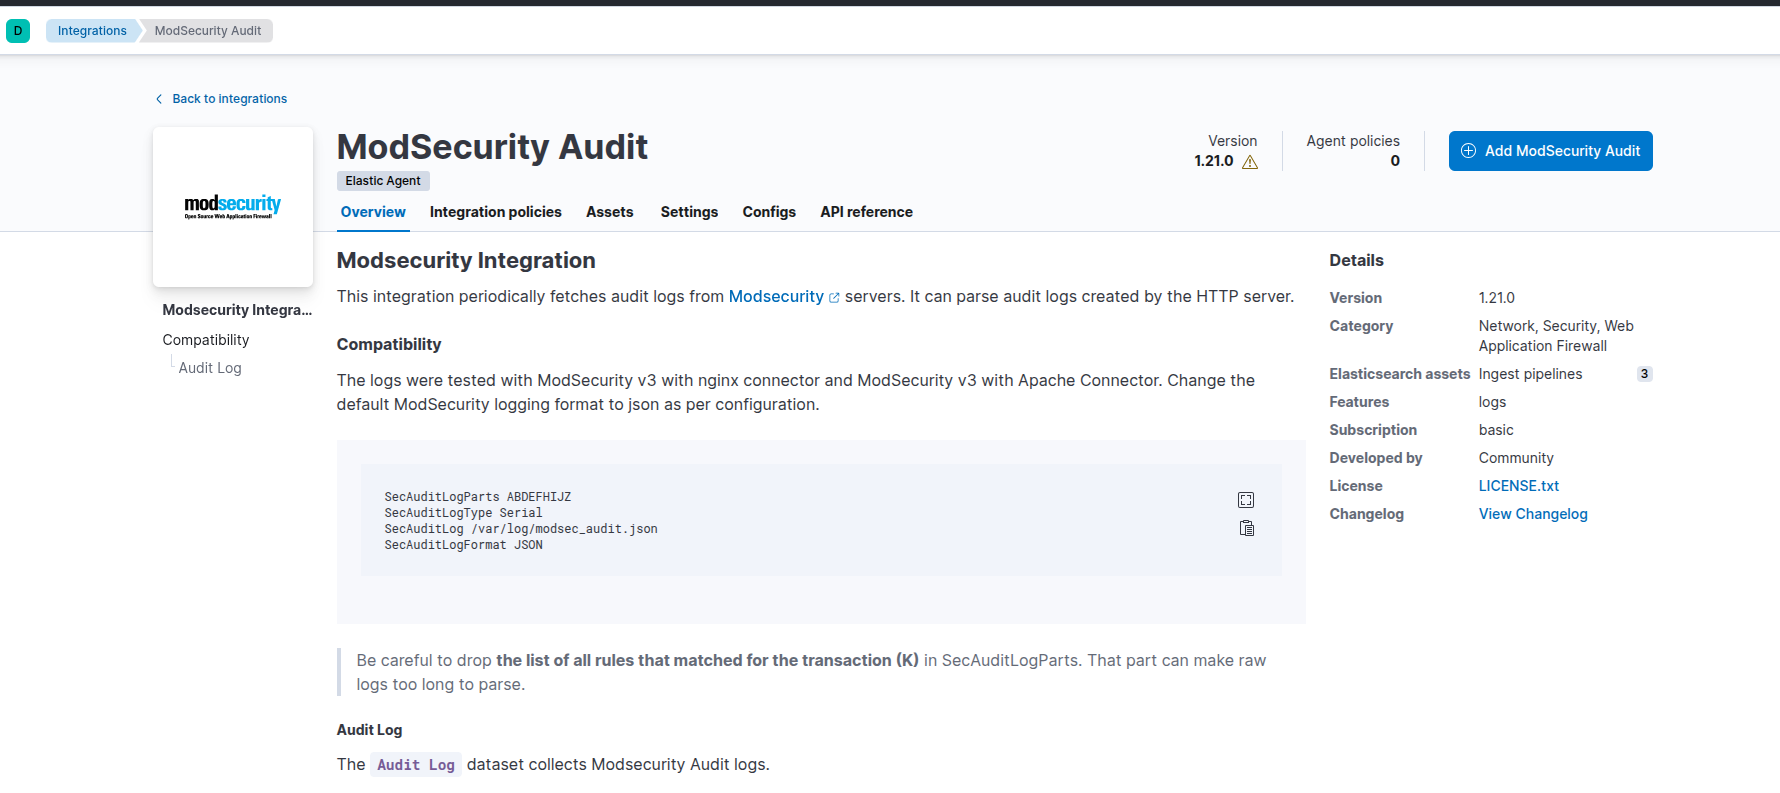 Example add integration to policy
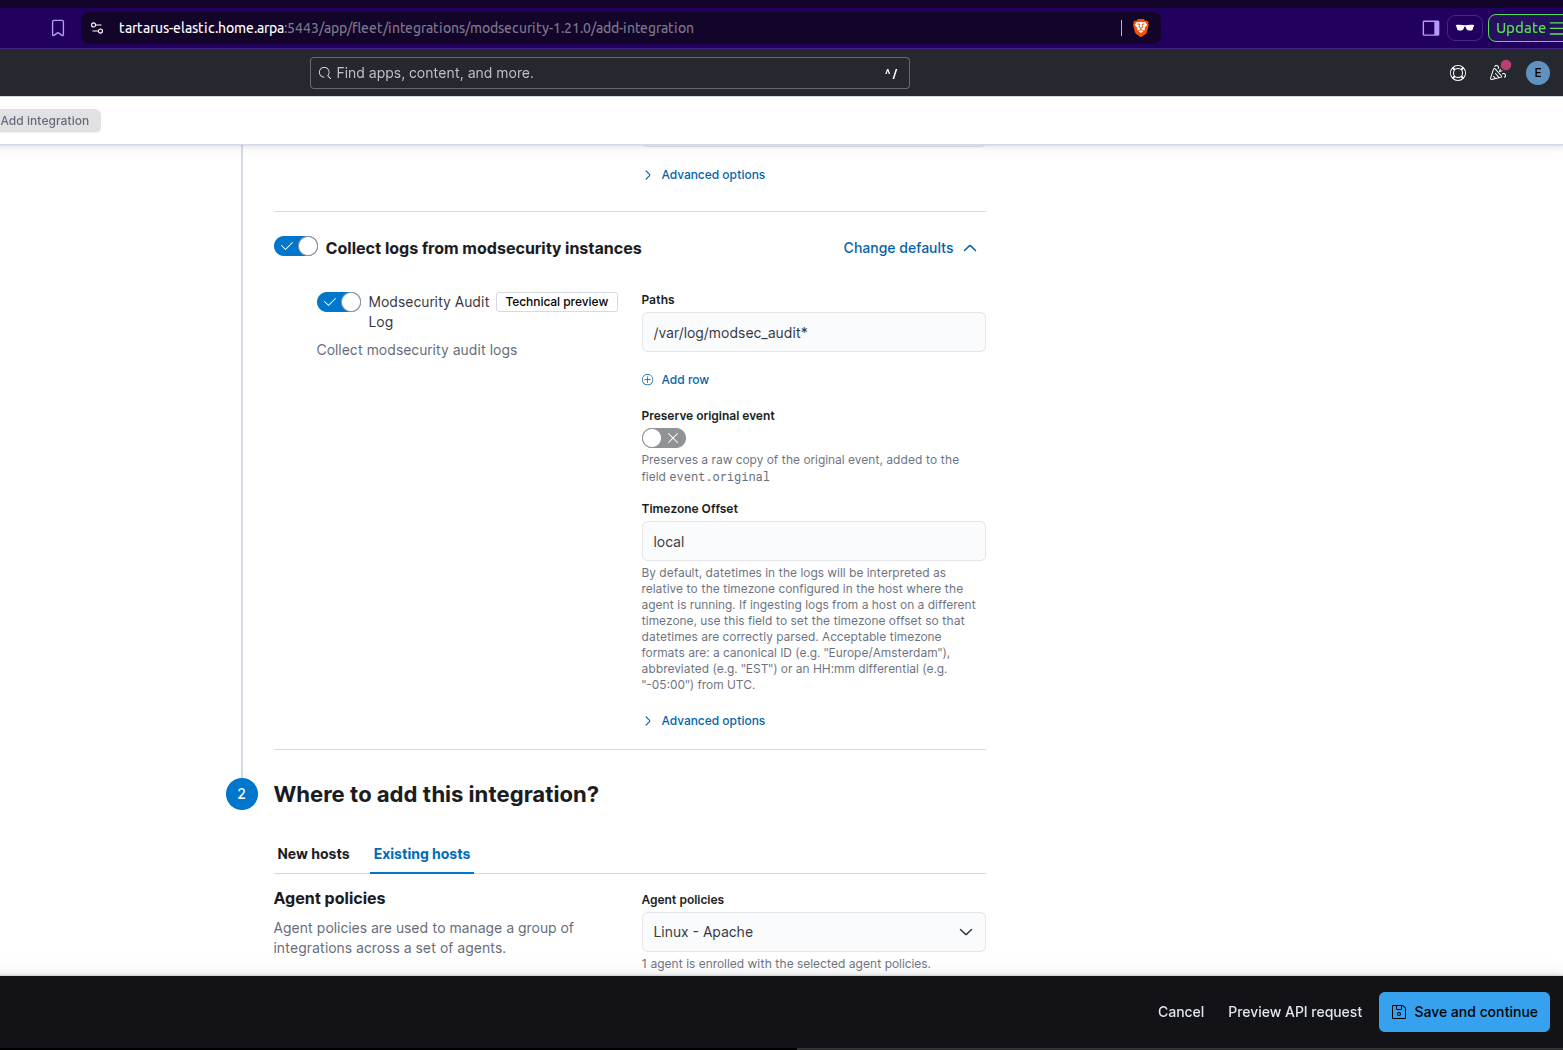
You will need to edit the default “Paths” to “/var/log/modsec_audit*” and scroll down to add it to the existing hosts group:
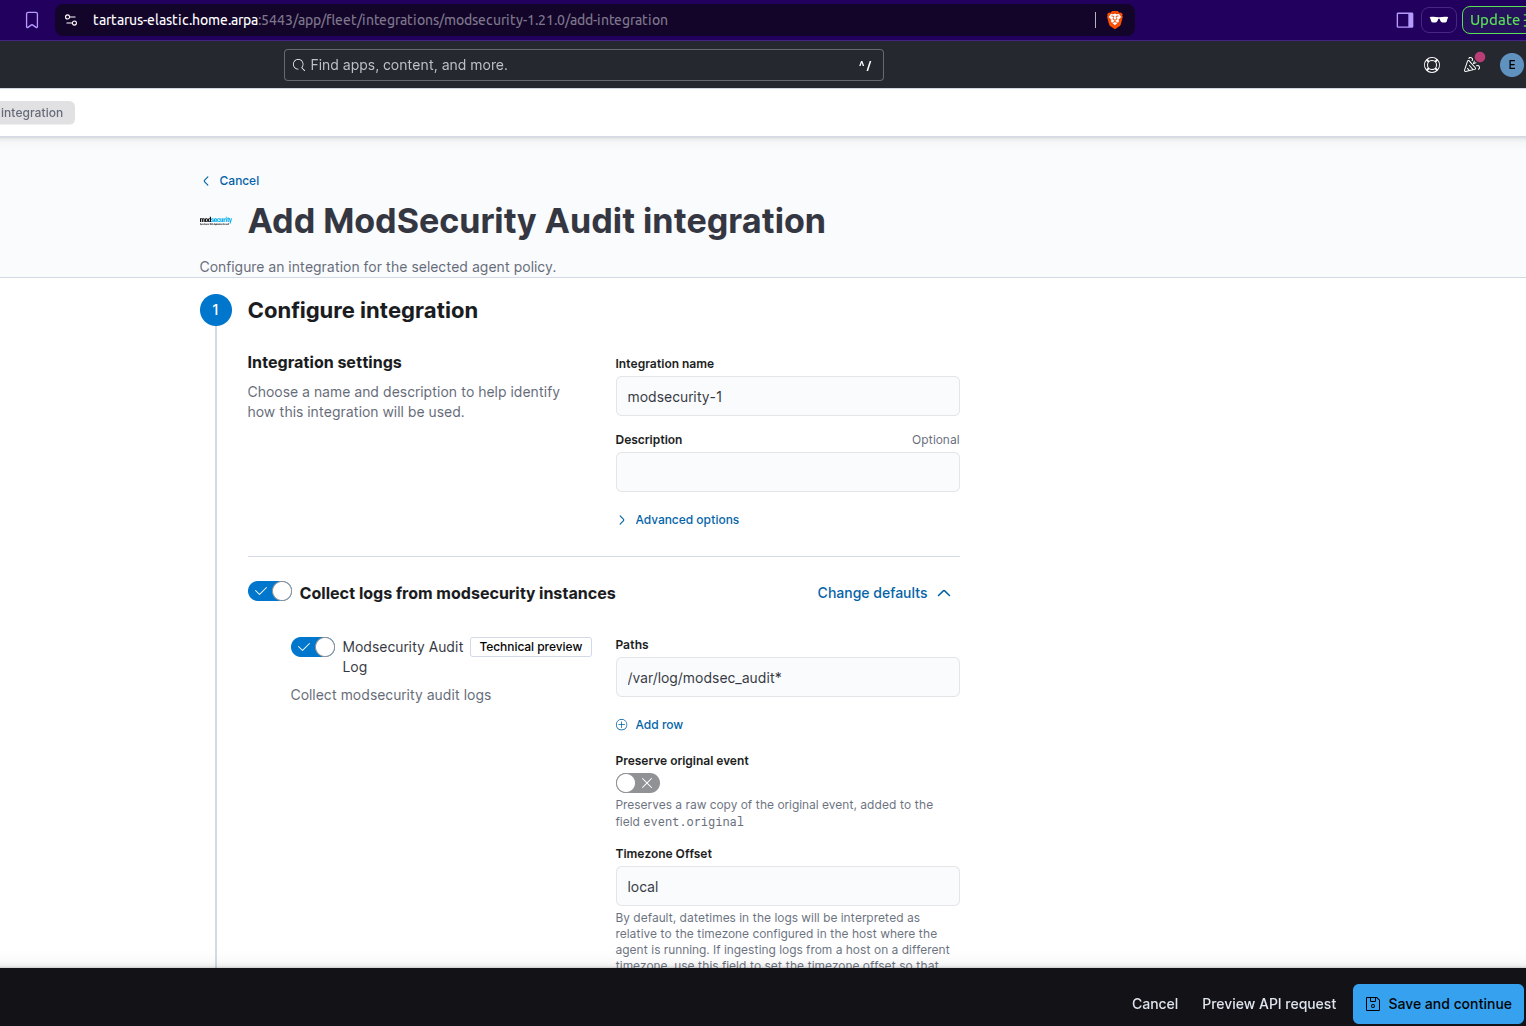 Example policy edit
Now change so it deploys to a Existing hosts group:
 Example host group
Finally click “Save and continue”.
You should now see:
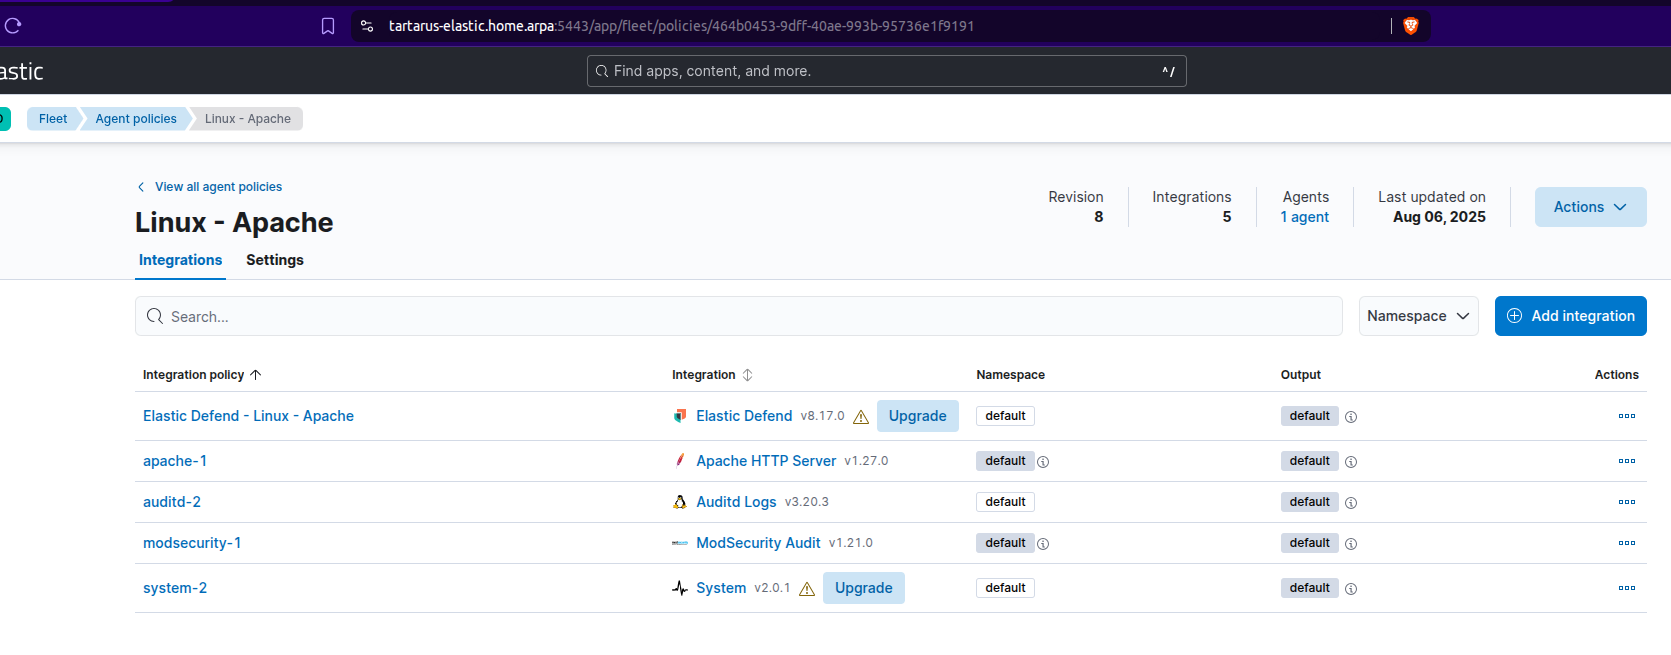 Example updated policy
There should be logs in the index now, navigate to the “Analytics > Discover” tab (Don’t forget to change the data view to “logs-*”):
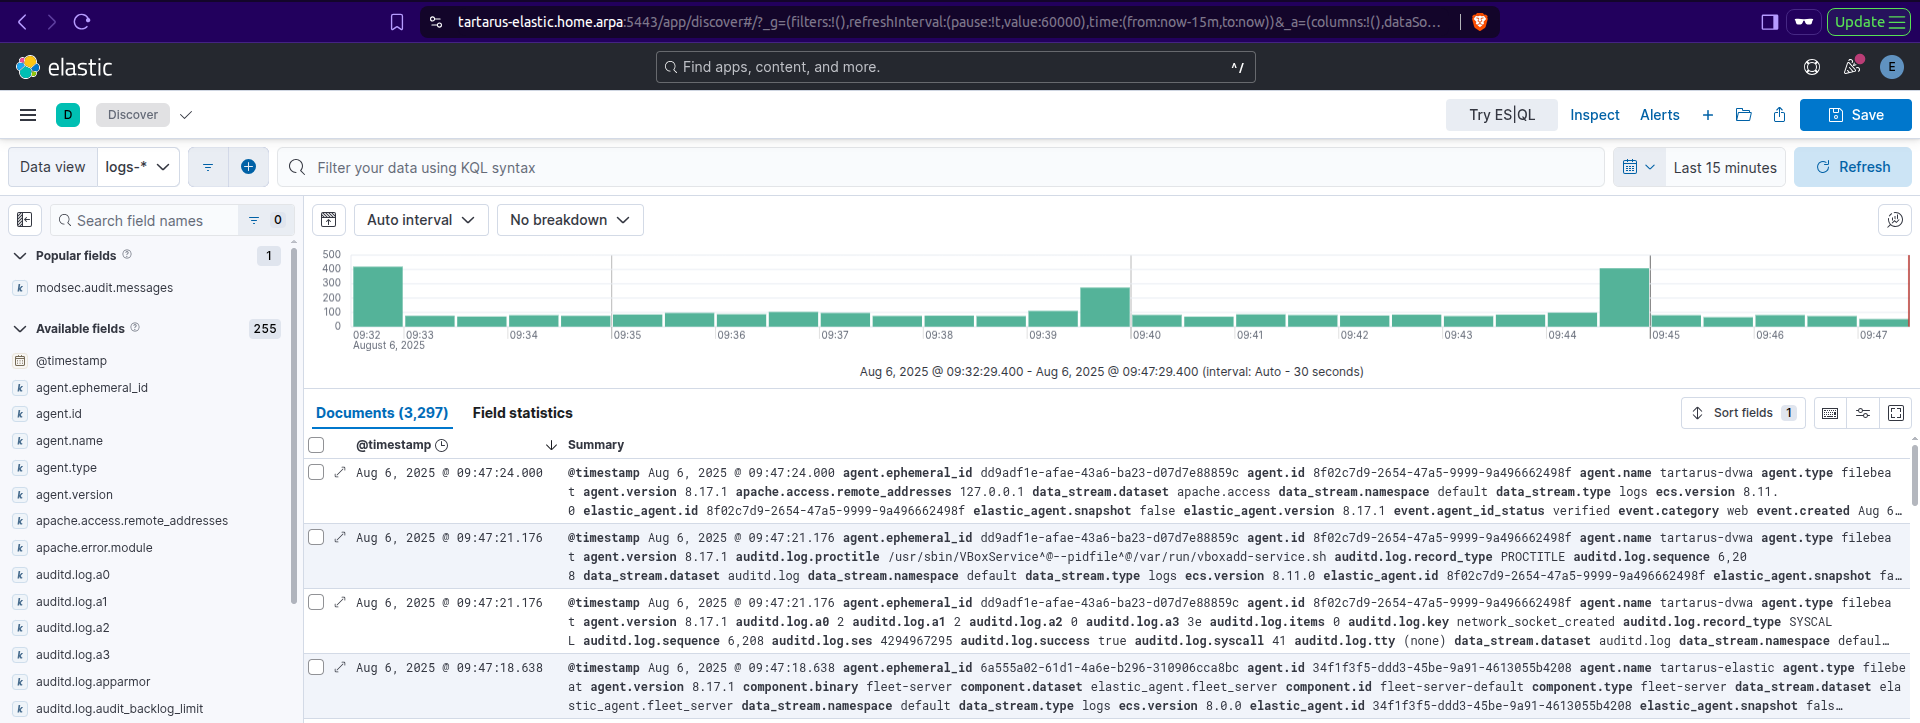 Example index view
Run a search for event.dataset : "modsecurity.auditlog":
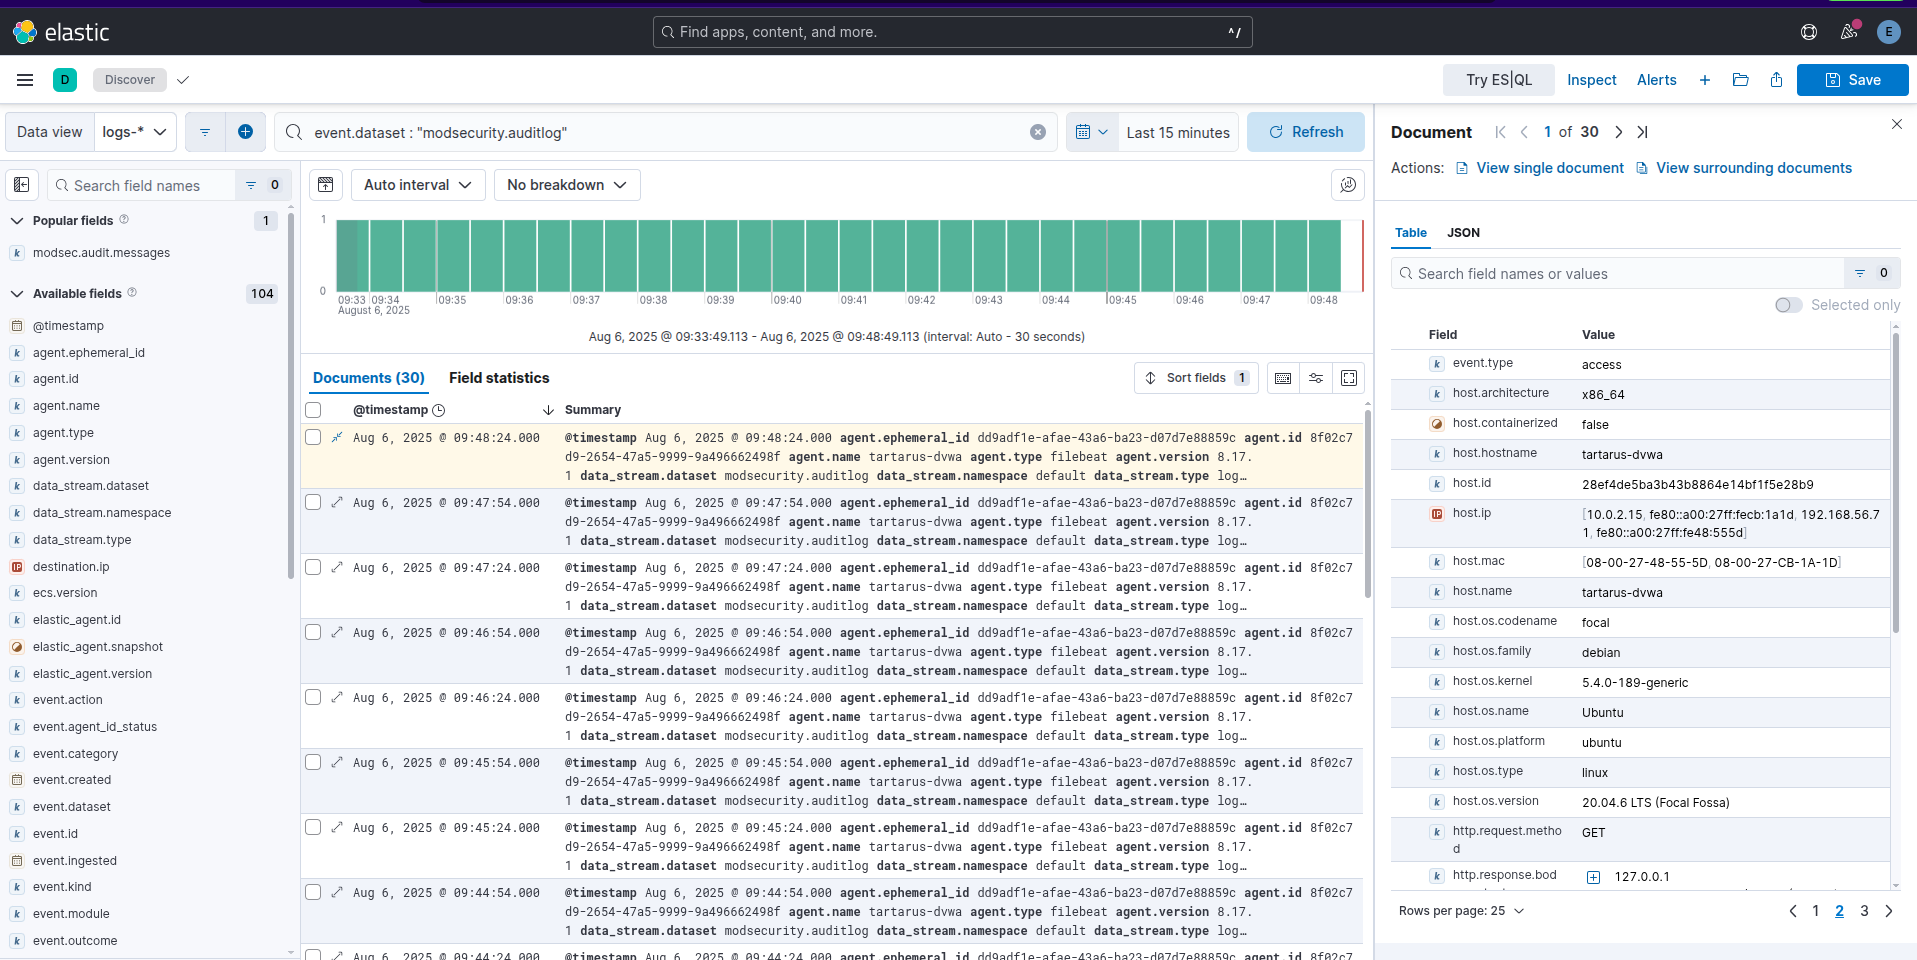 Example search for the modsec dataset
What are these logs? The Elastic Agent is making requests to “127.0.0.1” or the local IPv4 address, these are flagged as a “Warning” by ModSec. This is how the Elastic Agent keeps track of the Apache web server status:
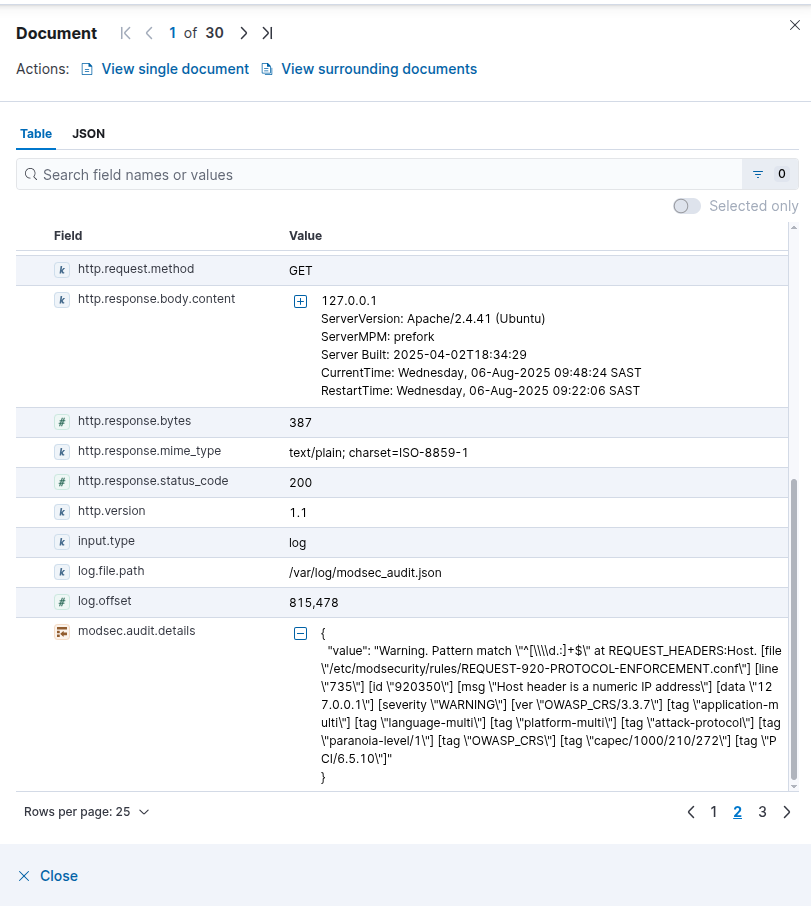 Example event details from modsec
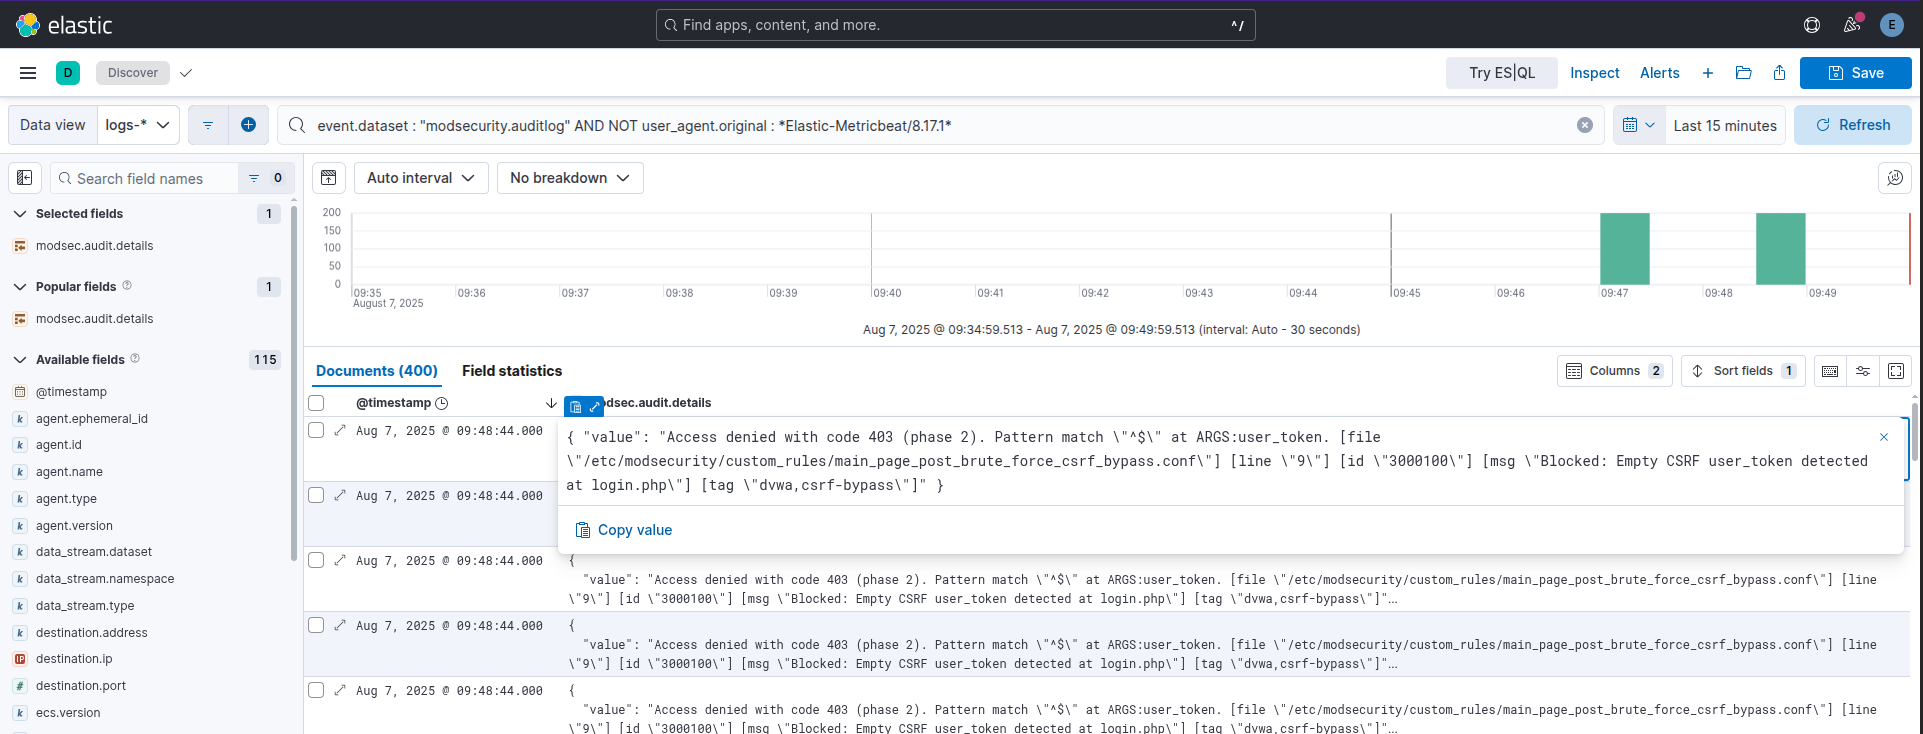
Under the “modsec.audit.details” key we see the reason, unfortunately it’s not fully parsed, it’s a weakness from the upstream Elastic parser hosted in GitHub.
Lets have a little test. From the Low Sec Recon post we know the following ffuf command should identify the correct subdirectory that the webserver is being served from, right?
1
ffuf -u "http://tartarus-dvwa.home.arpa/FUZZ" -mc 200 -r -w <(pencode -input /usr/share/wordlists/seclists/Fuzzing/1-4_all_letters_a-z.txt upper)
If you run this for some time (+- 3 min) the Elastic logs will start to look like:
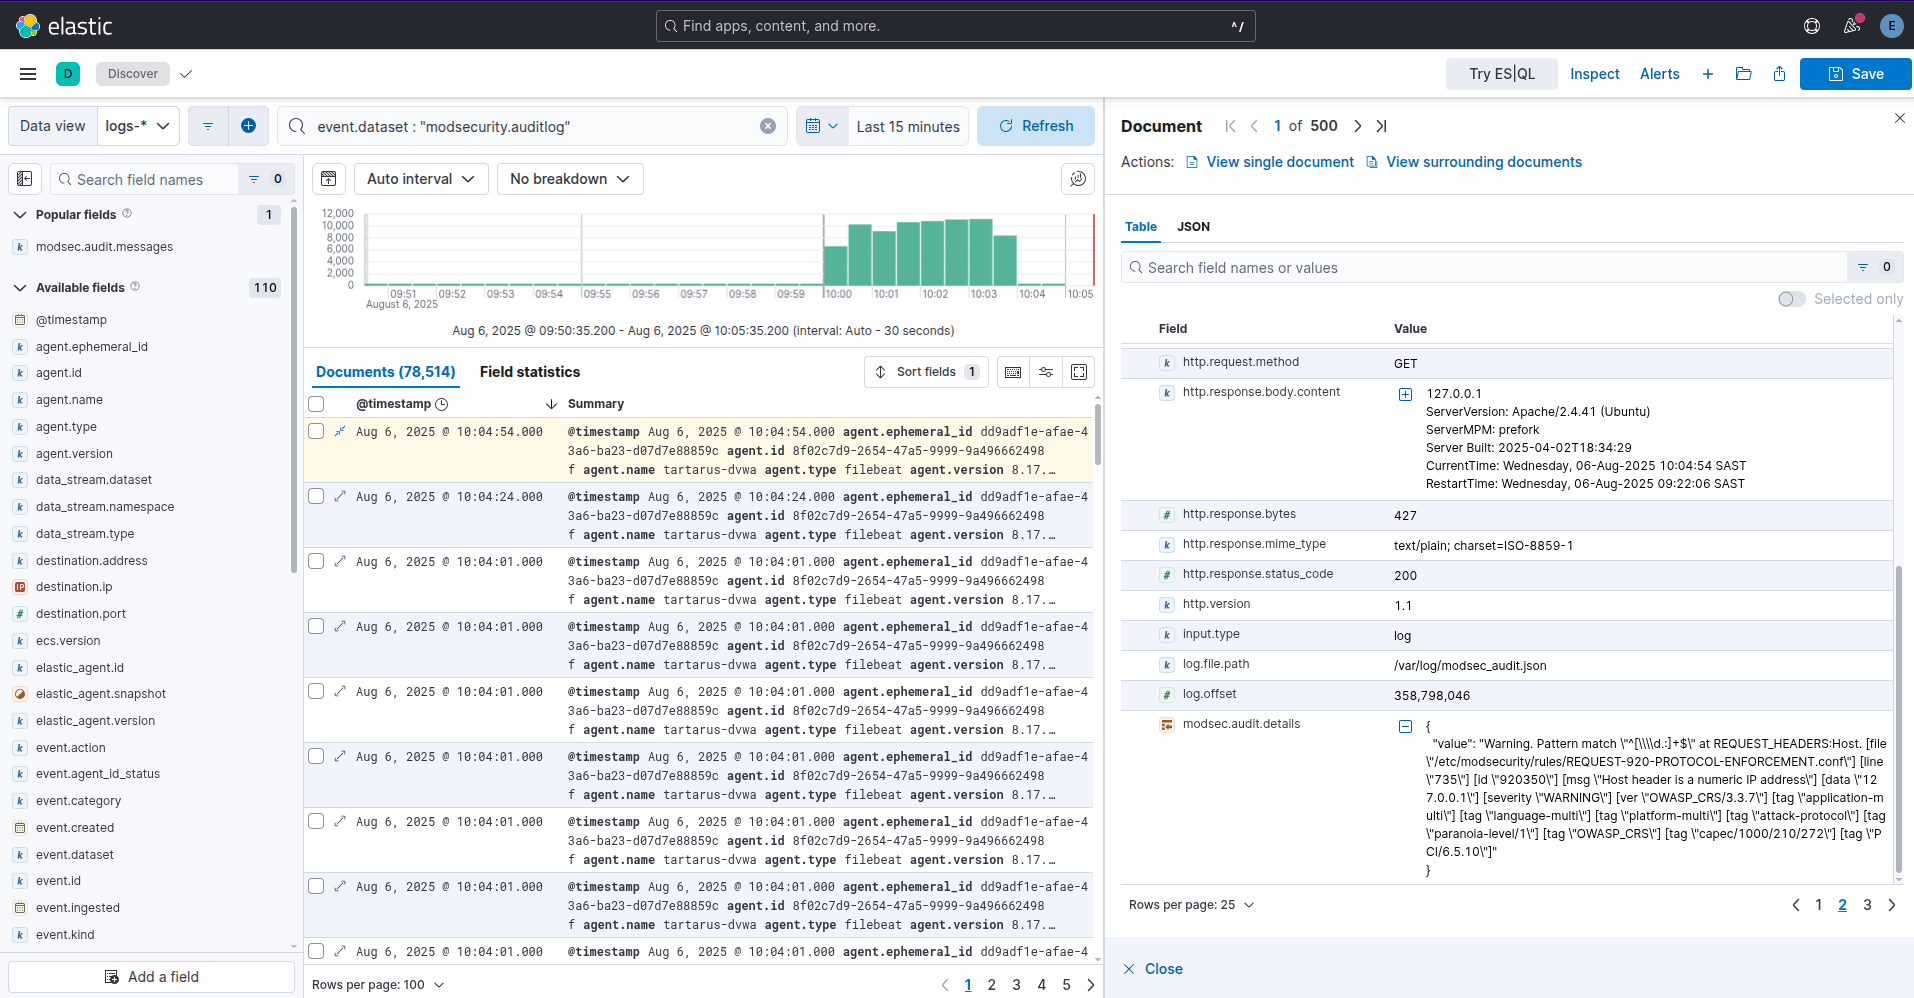 Example ffuf recon blocked by modsec
You’ll notice the scan takes much longer and won’t actually return anything since ModSecurity identifies the User-Agent correctly as ffuf and blocks these requests, nice!
What about our sneaky HEAD based ffuf scan?
1
ffuf -X HEAD -u "http://tartarus-dvwa.home.arpa/FUZZ" -H "User-Agent: Mozilla/5.0 (Windows NT 10.0; Win64; x64) AppleWebKit/537.36 (KHTML, like Gecko) Chrome/132.0.0.0 Safari/537.3" -r -w <(pencode -input /usr/share/wordlists/seclists/Fuzzing/1-4_all_letters_a-z.txt upper)
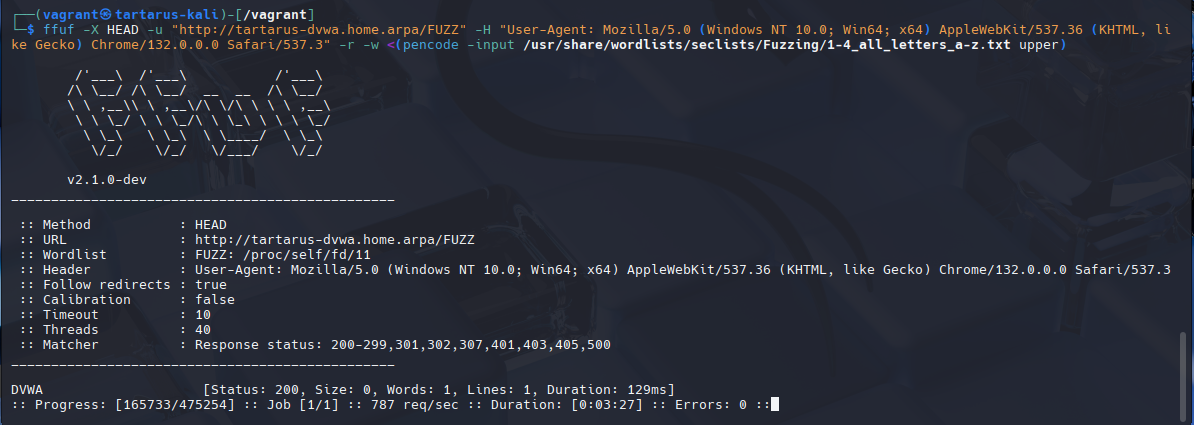 Example successful ffuf recon attempt
Success! The scan is slower than before because all requests now must go though the ModSecurity engine. Key take away, just because you have a WAF doesn’t automatically make you safe! The obfuscation is working on two levels, first it is not using the default ffuf User-Agent, secondly it is using an unusual HTTP Request method.
Just to prove it this is what the logs look like in the SIEM:
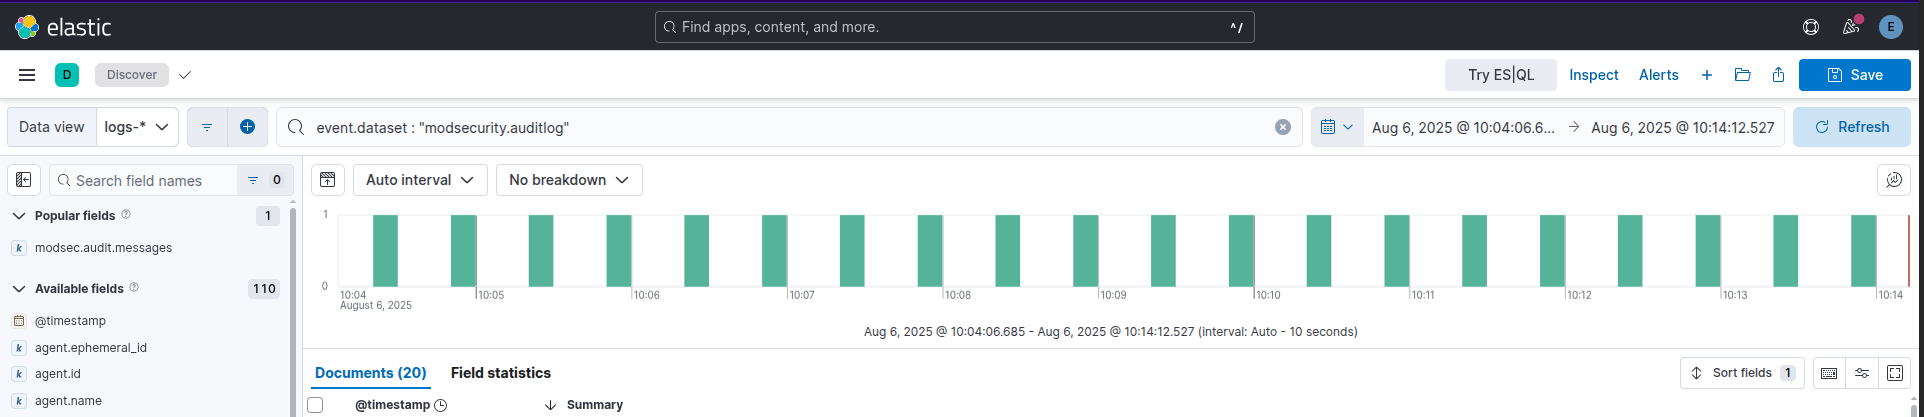 Example successful ffuf recon in the siem
Fixing SIEM Rules
To catch this activity in the SIEM it’s as simple as changing the rule to remove the GET based filtering (The updated SIGMA rule is loaded automatically when the SIEM is provisioned as SIGMA - Web Apache Correlation Directory Enumeration Med Sec):
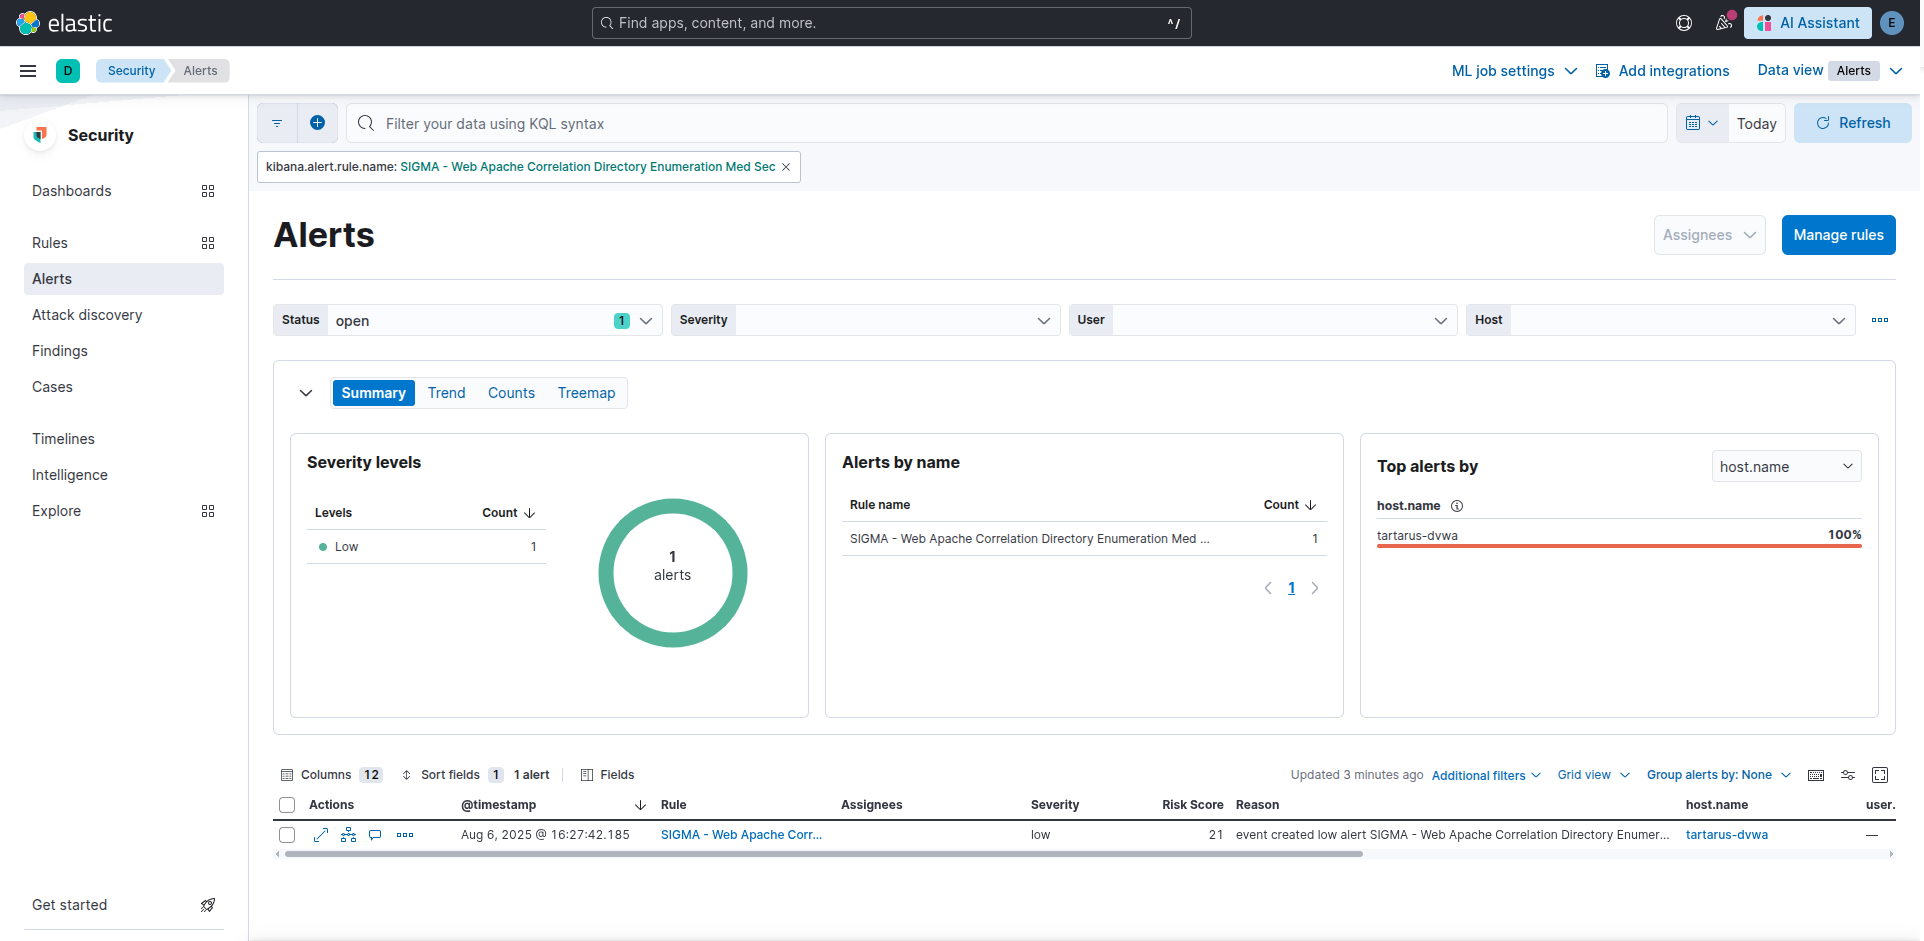 Example alert for the head based recon ffuf scan
Writing ModSecurity Rules
What about the brute force of the main login page?
All rules are on the Tartarus Lab GitHub in the modsecurity directory, place them into the /etc/modsecurity/custom_rules/ dir on the DVWA Ubuntu guest and restart the Apache service to load them.
At first I wrote a rule similar to a brute force rule to prevent the CSRF bypass attack, however this proved futile. Instead since no legitimate request should attempt to login without a valid CSRF token, why not just block all requests without it? This is what the rule looks like and I break it down below:
1
2
3
4
5
6
7
8
9
10
11
12
13
SecRule REQUEST_METHOD "POST" "id:3000100,\
    phase:2,\
    chain,\
    deny,\
    status:403,\
    log,\
    auditlog,\
    msg:'Blocked: Empty CSRF user_token detected at login.php',\
    tag:'dvwa,csrf-bypass'"

    SecRule REQUEST_URI "@endsWith /DVWA/login.php" "chain"

        SecRule ARGS:user_token "@rx ^$"
We define the HTTP method we are intrested in, in line 1:
1
SecRule REQUEST_METHOD "POST" "id:3000100,\
The phase we can inspect is phase 2 based on this diagram on their GitHub:
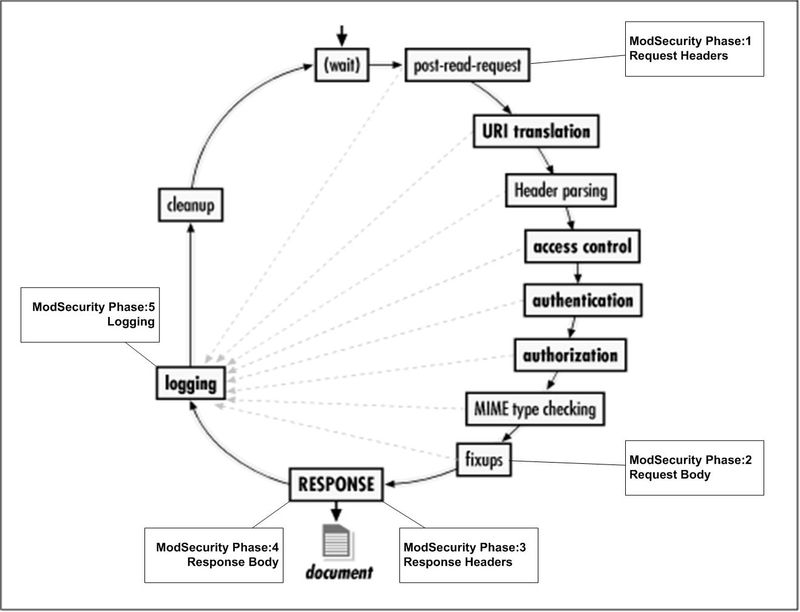 Example modsec phases
Phase 2 then corresponds to the Request Body, which is where the POST request body would be example:
1
Body: username=admin&password=cookie&user_token=&Login=Login
We then define it as a chain rule type so it can be chained when other conditions are met:
1
2
3
4
5
    chain,\
    deny,\
    status:403,\
    log,\
    auditlog,\
We also define that it will be a block with status 403 and log the resulting action into our logfile, that then goes to Elastic.
The message is simple:
1
    msg:'Blocked: Empty CSRF user_token detected at login.php',\
Finally the part that detects what to block:
1
2
3
    SecRule REQUEST_URI "@endsWith /DVWA/login.php" "chain"

        SecRule ARGS:user_token "@rx ^$"
We define what URL to target being the main login for the app (can be made more generic), then if any ARGS have an empty “user_token” we block the requests.
Recon Medium Sec - Purple Team
Nuclei
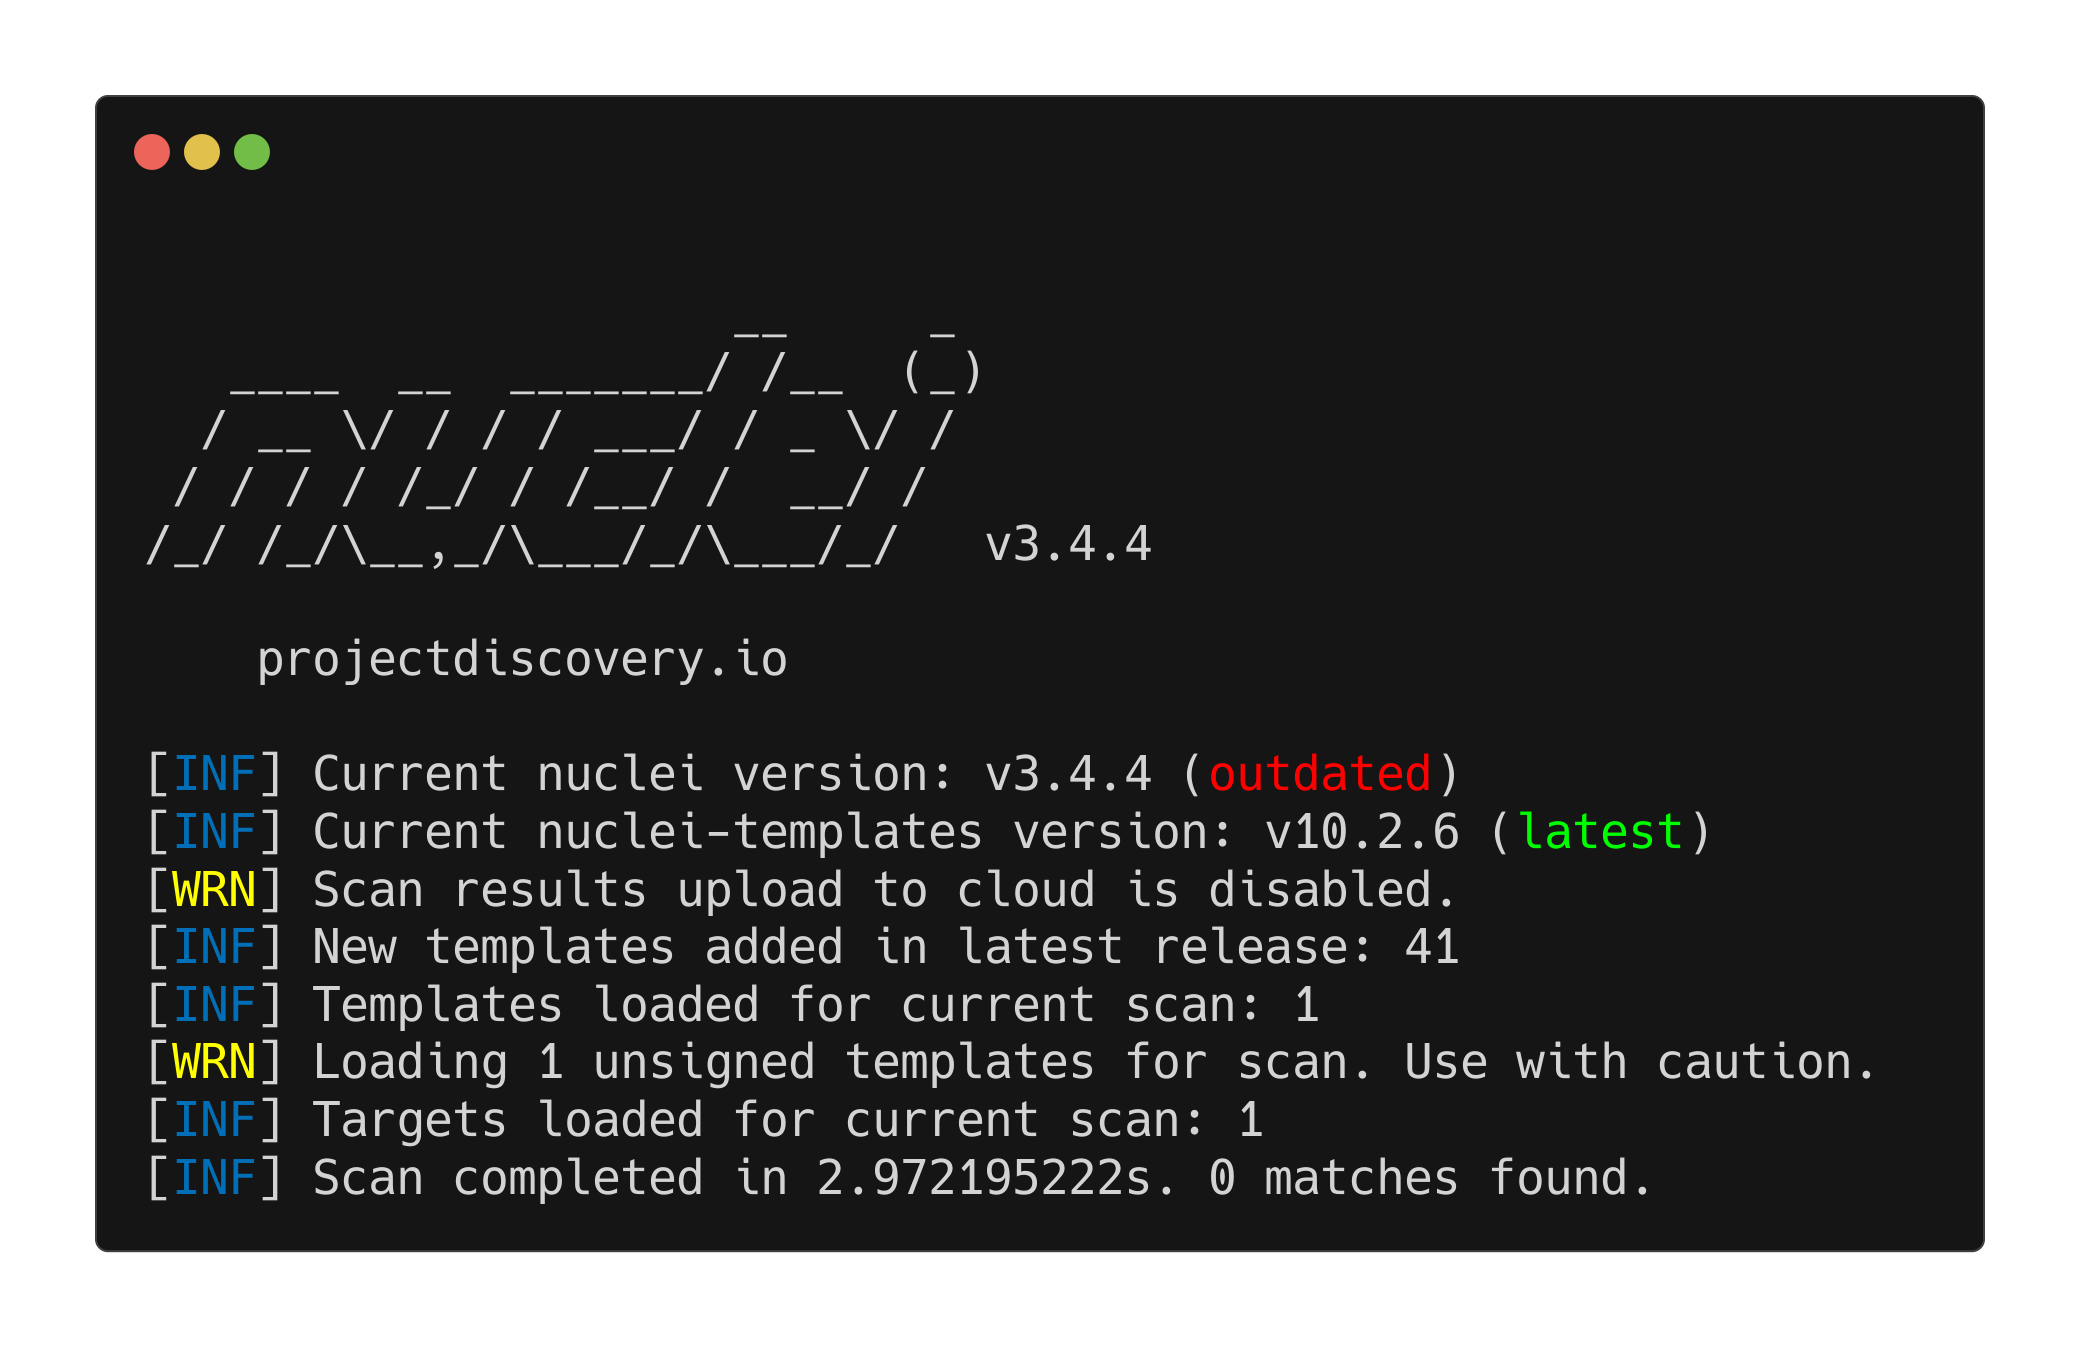
You can test it with the existing Nuclei template dvwa-brute-force-main-login-csrf-bypass:
1
nuclei -u http://tartarus-dvwa.home.arpa/DVWA -t /vagrant/nuclei-templates/dvwa/dvwa-brute-force-main-login-csrf-bypass.yaml
 Example failed nuclei scan with modsec blocking requests
We can see the logs in the SIEM as well:
 Example blocked brute force attempts
I’ve also written a ModSec rule to detect “normal” brute forces against the main login page, however due to the apps setup it only works if the sender is following redirects…
1
2
3
4
5
6
7
8
9
10
11
12
13
14
15
16
17
18
19
20
21
22
23
24
25
# Step 1: Track failed login attempts in responses
SecRule RESPONSE_BODY "Login failed" \
    "id:1000001,\
    phase:4,\
    t:none,\
    capture,\
    msg:'Failed login detected in response',\
    tag:'login-bruteforce',\
    severity:'WARNING',\
    ver:'OWASP_CRS/BruteForce-Login',\
    setvar:ip.failed_login_counter=+1,\
    expirevar:ip.failed_login_counter=60"

# Step 2: Block or alert if too many failures occur from the same IP
SecRule IP:failed_login_counter "@gt 5" \
    "id:1000002,\
    phase:1,\
    t:none,\
    msg:'Potential brute-force attack detected',\
    tag:'login-bruteforce',\
    severity:'CRITICAL',\
    ver:'OWASP_CRS/BruteForce-Login',\
    deny,\
    log
    "
Example (note the -fr flag for follow redirects, would emulate a browser more closely). This is a new Nuclei template I’ve written to exemplify the process:
1
nuclei -u http://tartarus-dvwa.home.arpa/DVWA -t /vagrant/nuclei-templates/dvwa/dvwa-brute-force-main-login.yaml -fr
 Example failed nuclei brute force
Credits
Image thanks to unsplash
Icon thanks to Show-password icons created by juicy_fish - Flaticon
ModSecurity install steps from https://www.inmotionhosting.com/support/server/apache/install-modsecurity-apache-module/#ubuntu