DVWA Recon Low Sec - Red And Blue Team

This post demonstrates how to recon the DVWA. The Blue Team section demonstrates how to use the Elastic SIEM to detect the activity. The Tartarus Lab Vagrant file we will bring up the whole infrastructure (Red or Blue). I’ve separated the recon phases into their respective difficulties to demonstrate more advanced techniques in later posts.
The full list of Shieldia DVWA posts is located here: https://shieldia.co/posts/DVWA_Index/
Video
Red
Blue
Prerequisites
If you don’t currently have a Damn Vulnerable Web Application (DVWA) instance you can follow along at home with a simple git clone & vagrant up if your host system meets the minimum specs.
Red team only deploys Opnsense, DVWA, and Kali.
Blue Team deploys the whole environment.
Recon Low Sec - Red Team
From here on out I will assume you are using the Tartarus Lab
If you are NOT using the Tartarus Lab add the DVWA node to your Kali
/etc/hostsfile:
On a fresh install you must enable the backend database
Username: admin
Password: password
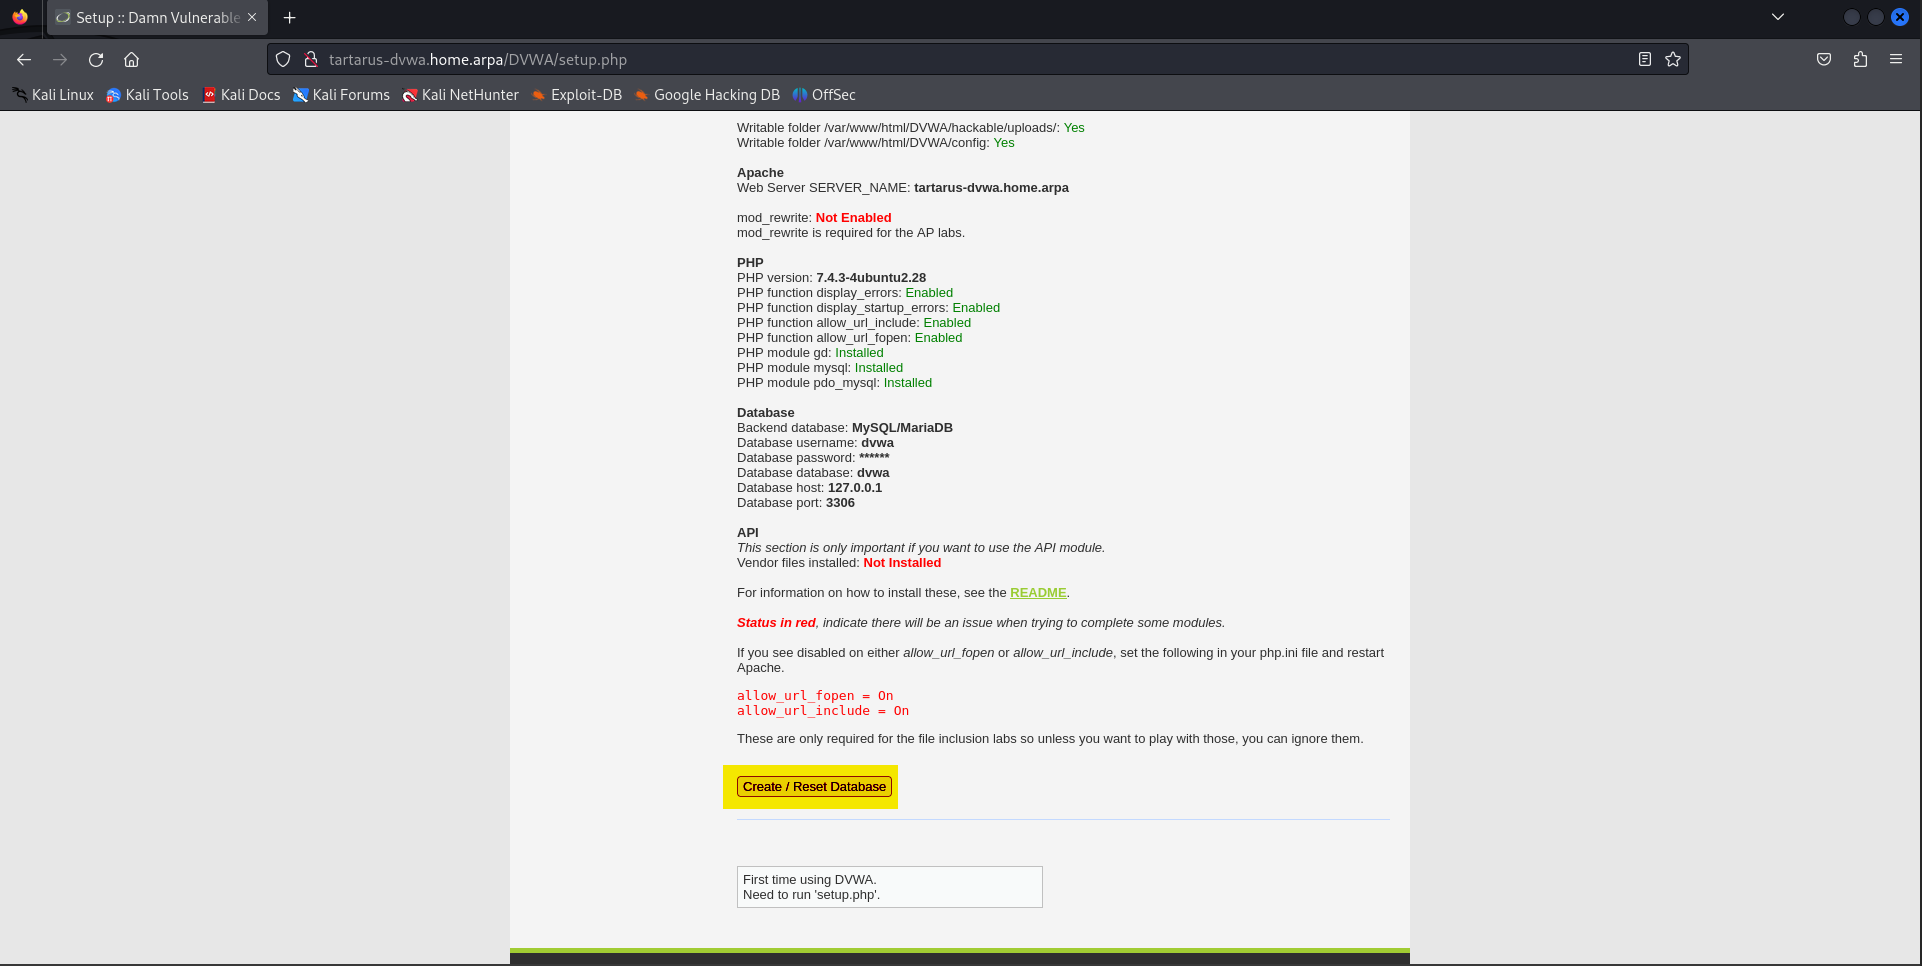 Create backend dvwa database
Nmap
The first “active recon” tool in almost any engagement. We will do a simple “Stealth Scan” -sS with nmap. The -sS will do a half-open Transmission Control Protocol (TCP) SYN scan. This is defined as “Stealth” for legacy reasons, older firewalls sometimes wouldn’t log the connection since it’s not “proper.” Opnsense for example will log on the first SYN, enterprise grade Juniper or Cisco can be configured to log on the open or close of a TCP connection.
For other nmap options a do a man namp will open the manual page for the application.
From the Kali guest:
Open a terminal by clicking on this icon:
 Kali terminal icon
Now run the following command:
1
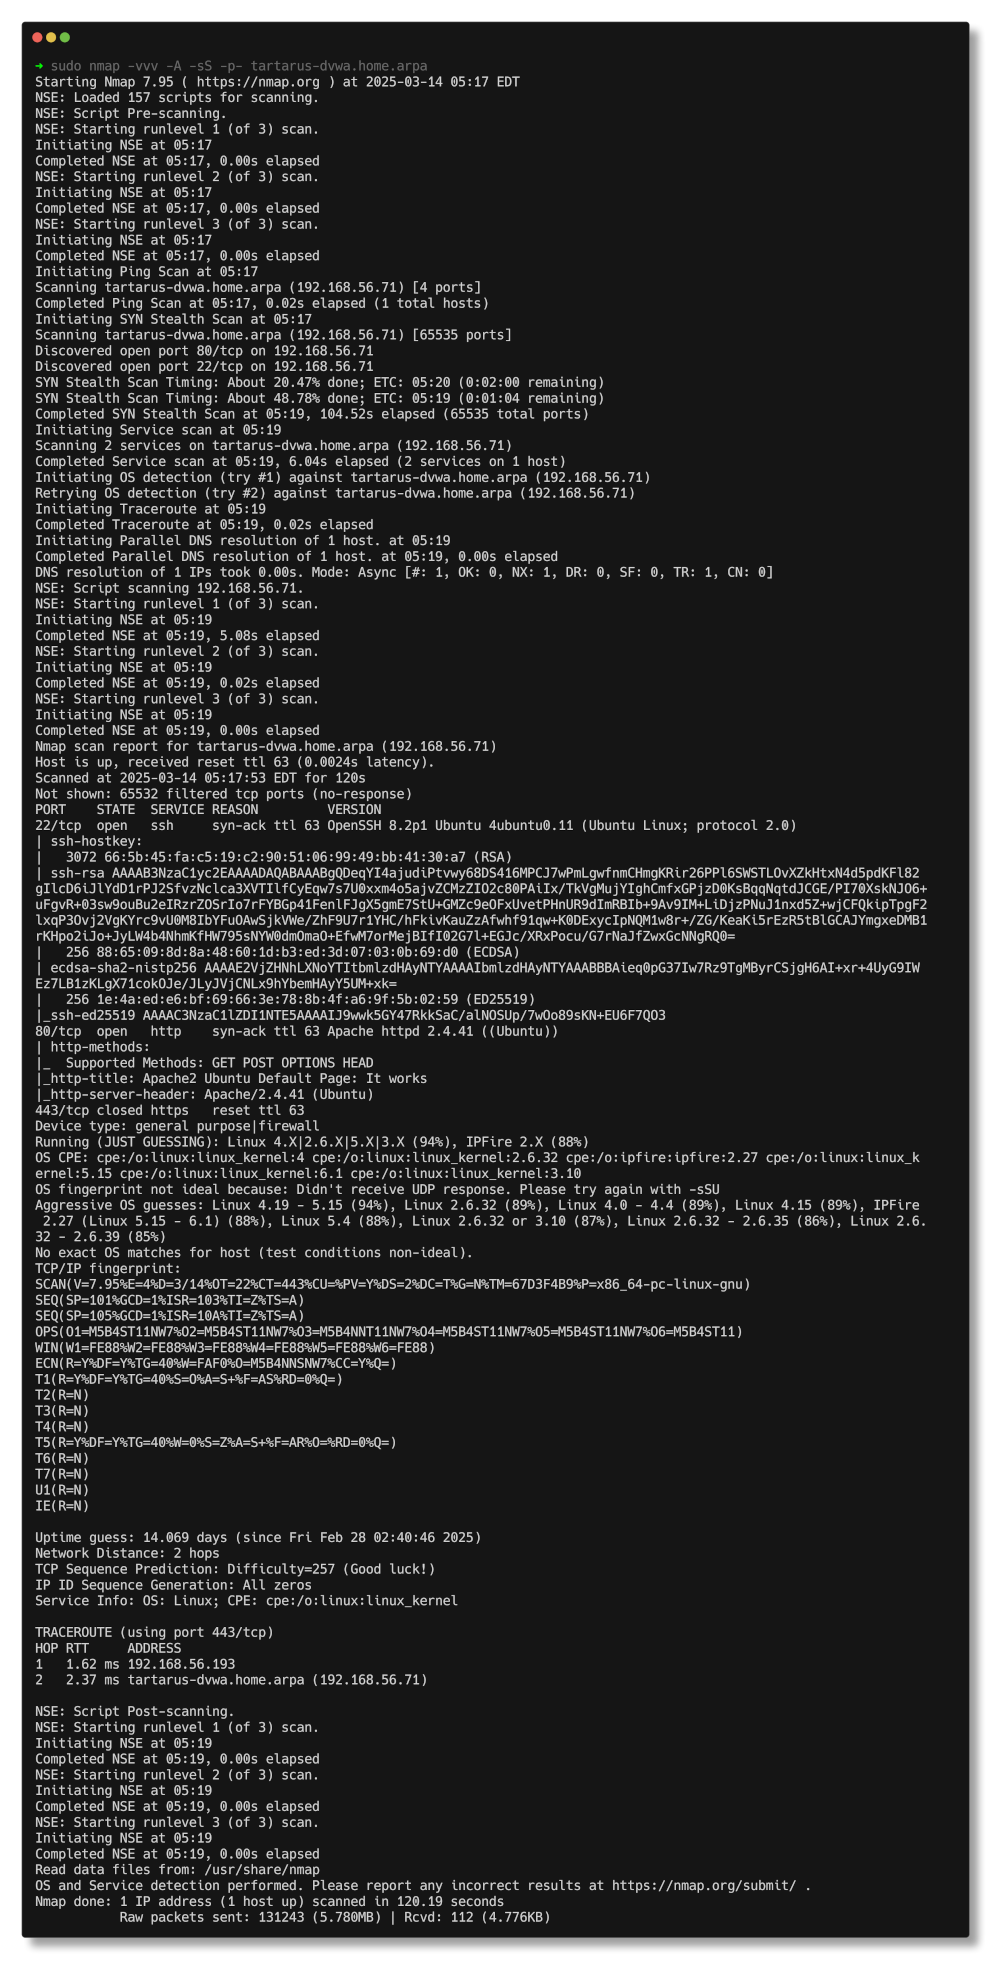
sudo nmap -vvv -A -sS -p- tartarus-dvwa.home.arpa
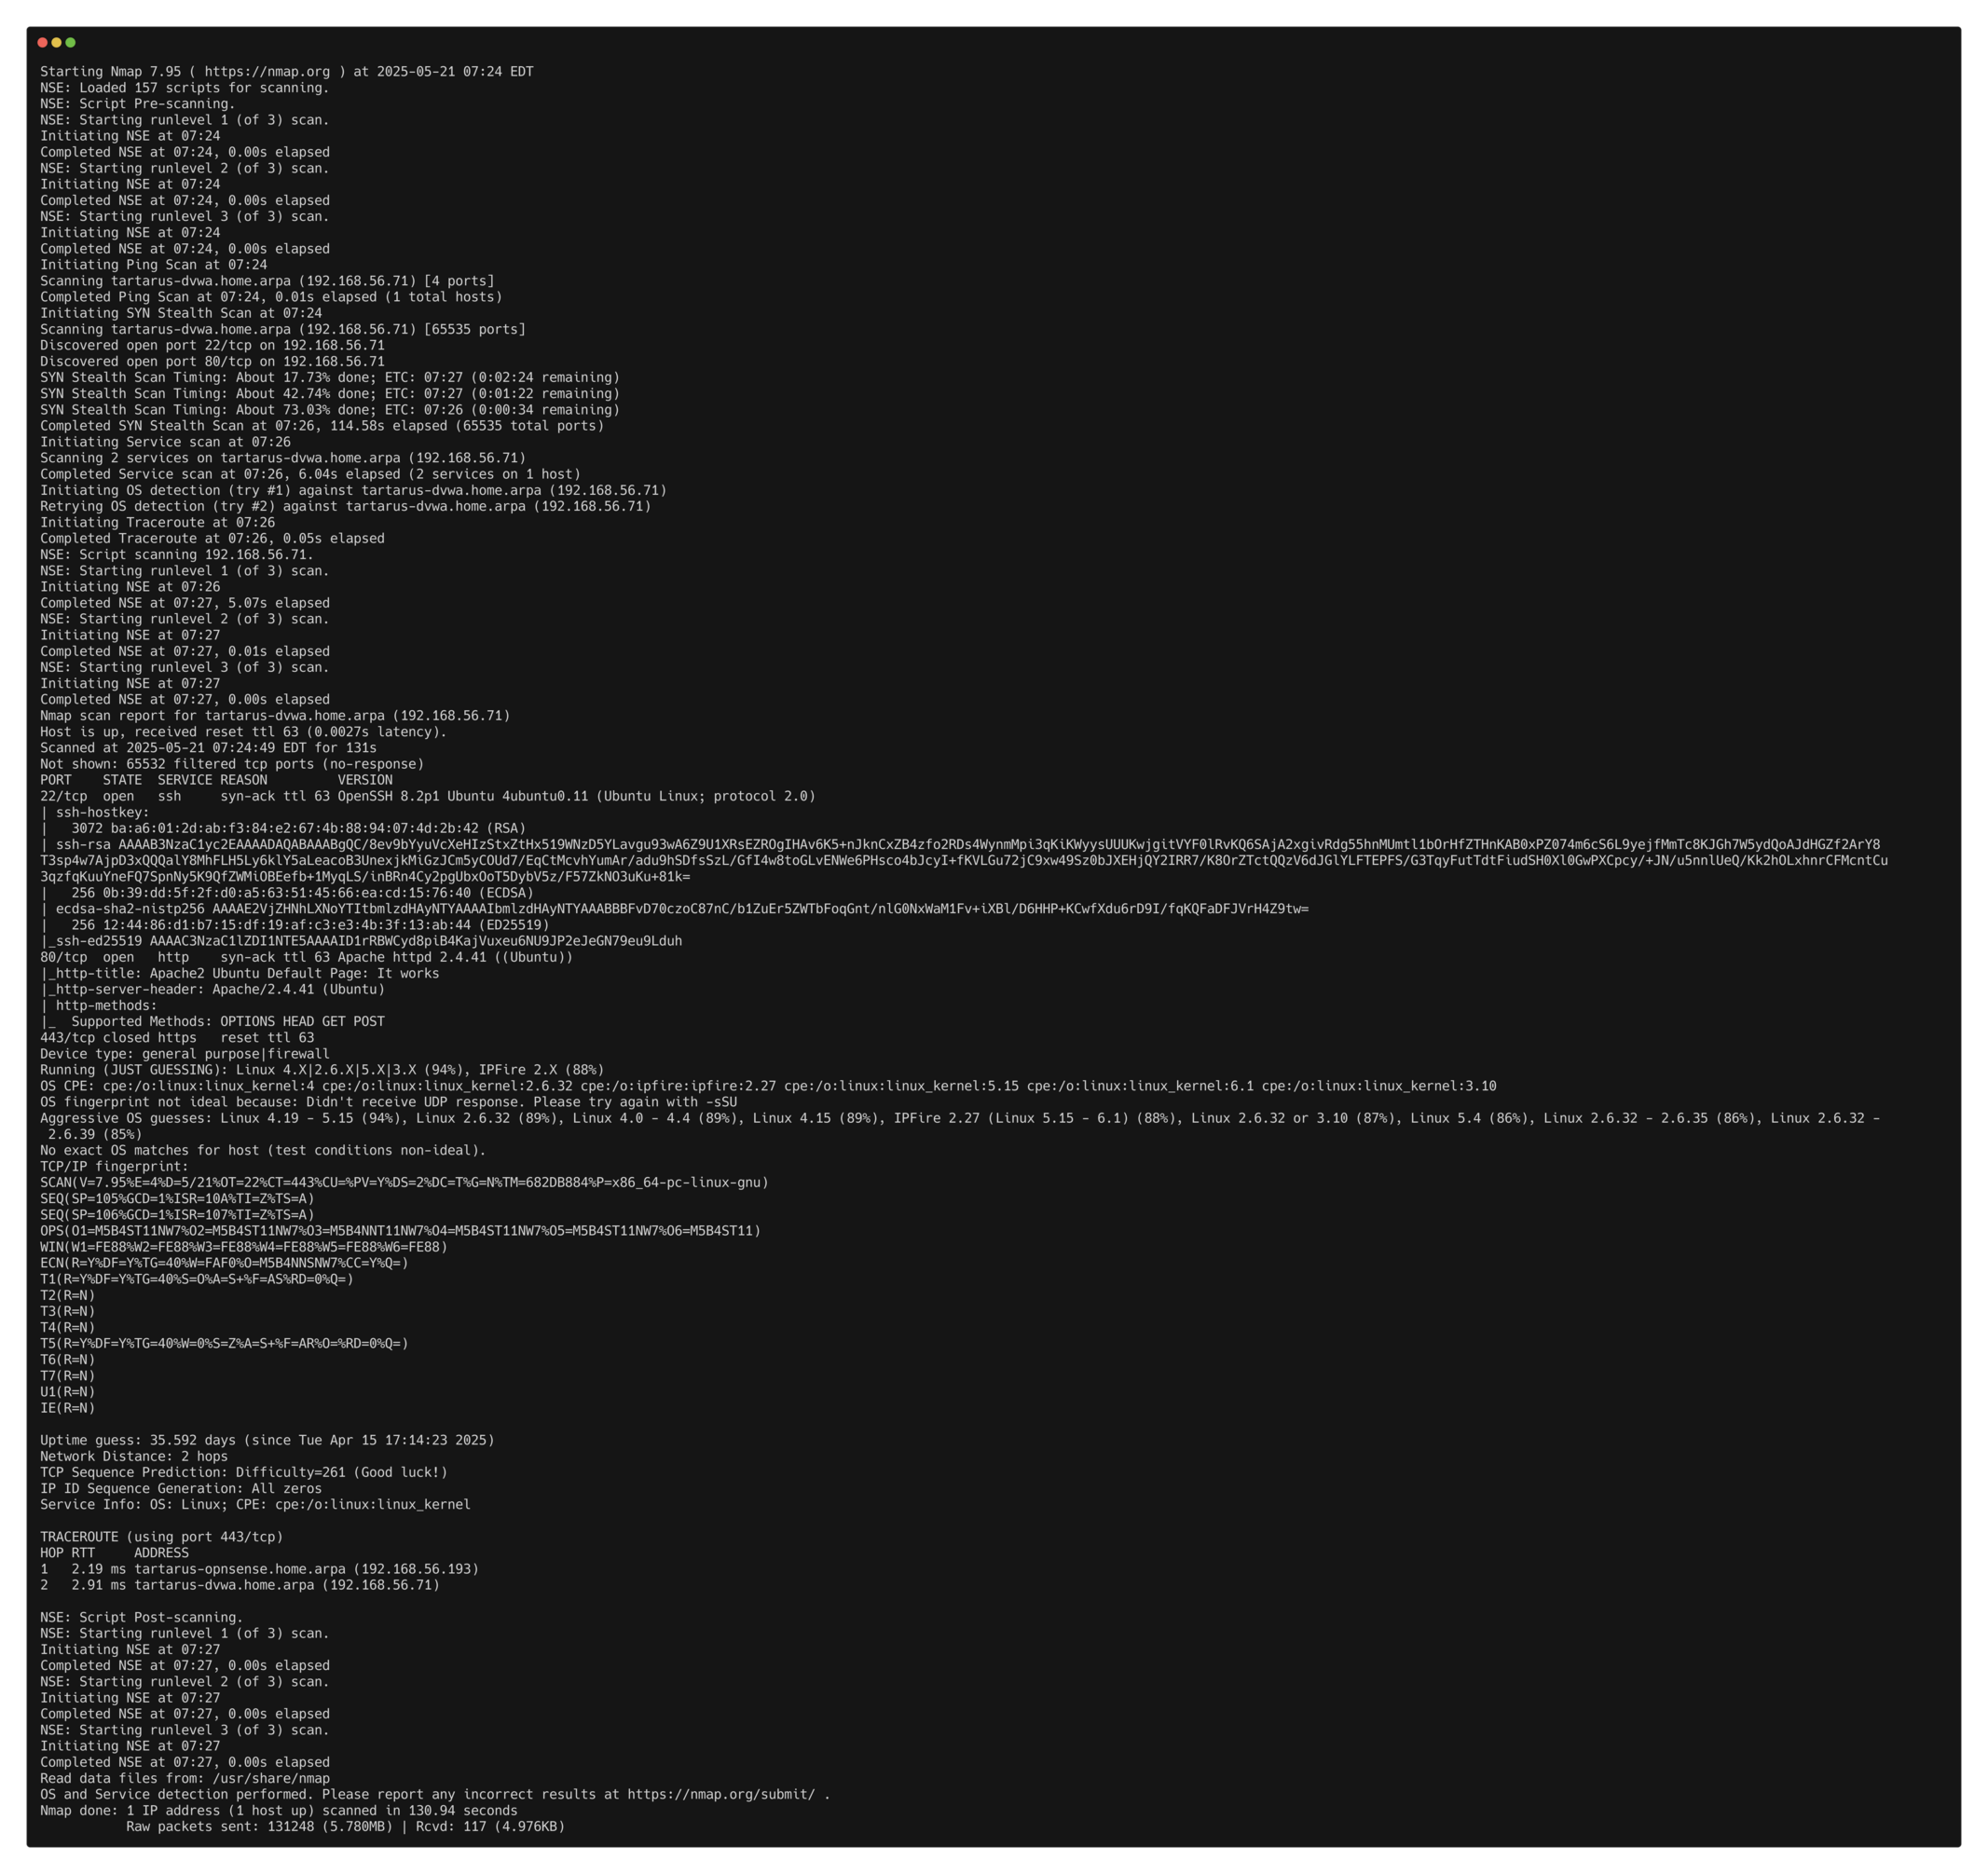 Nmap stealth scan low sec
In the output above we can see ports 22 and 80 are open. If you are not using Tartarus it will most likely only be port 80.
This gives us confirmation we are dealing with a web app, normally served on TCP port 80.
Lets have a look at this webpage navigate to:
1
http://tartarus-dvwa.home.arpa
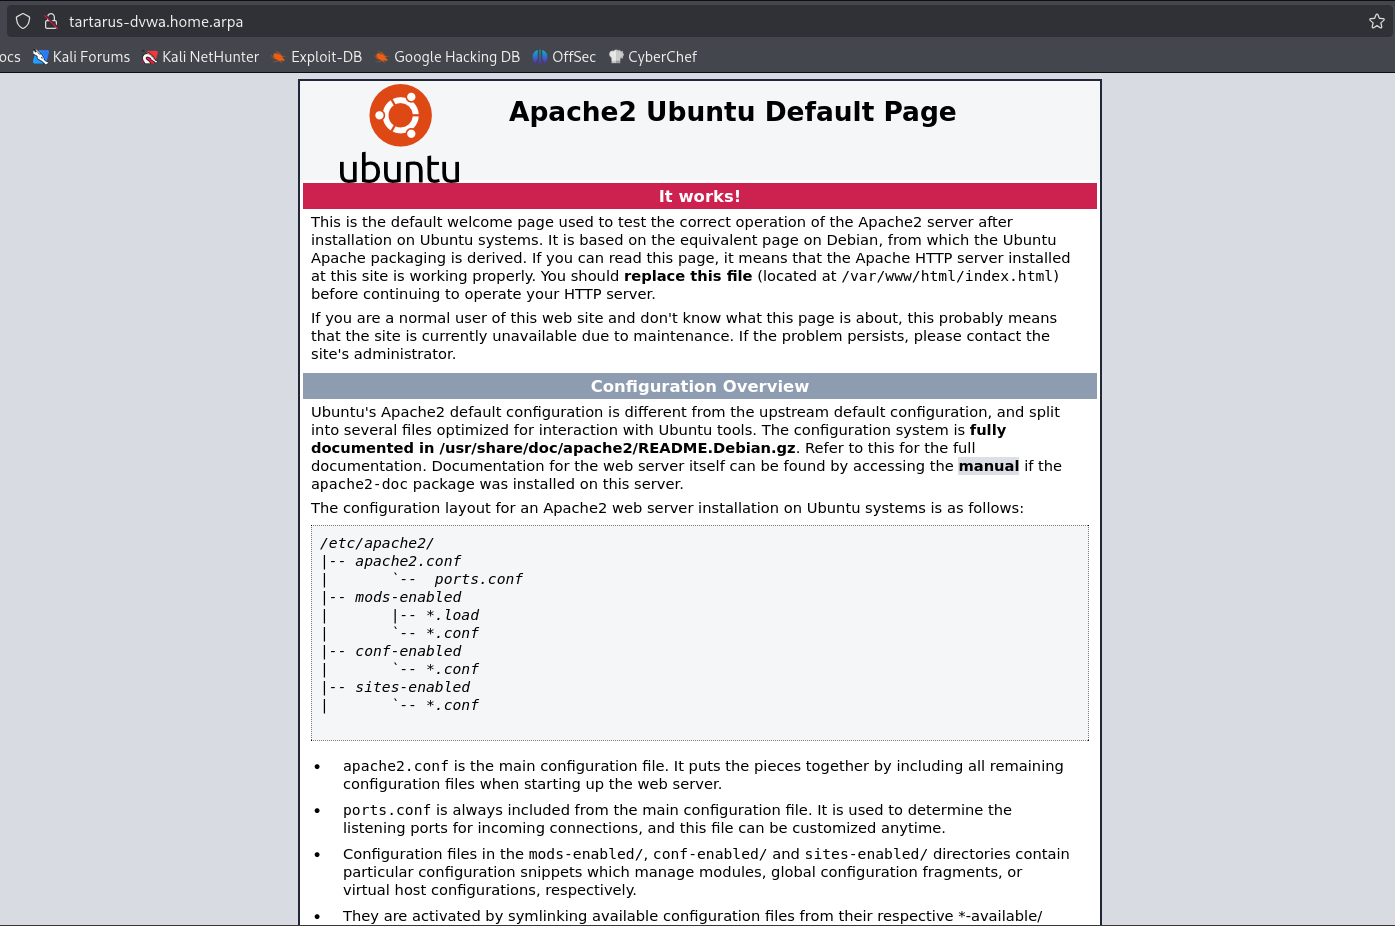 DVWA landing webpage
Strange, seems we are missing something.
Side Channel: The Seven Deadly SYNs
A normal SYN connection is defined (Section 3.5) in RFC 9293 (supersedes RFC 793) called the TCP “three-way handshake”:
sequenceDiagram
    participant Attacker
    participant DVWA_Server

    %% Normal TCP connection
    Attacker->>DVWA_Server: SYN
    DVWA_Server-->>Attacker: SYN-ACK
    Attacker-->>DVWA_Server: ACK
How nmap does the SYN scan:
sequenceDiagram
    participant Attacker
    participant DVWA_Server

    %% Normal TCP connection
    Attacker->>DVWA_Server: SYN
    DVWA_Server-->>Attacker: SYN-ACK
If the port is open the DVWA_Server responds with a SYN-ACK. These flags are set in the TCP header inside the network packets.
For example the first packet could look something like (SYN):
packet-beta
  0-15: "Source Port (47921)"
  16-31: "Destination Port (80)"
  32-63: "Sequence Number (1)"
  64-95: "Acknowledgment Number (0)"
  96-99: "Data Offset (20)"
  100-103: "Reserved"
  104: ""
  105: ""
  106: ""
  107: ""
  108: ""
  109: ""
  110: "SYN"
  111: ""
  112-127: "Window (1024)"
  128-143: "Checksum (0xaadd)"
  144-159: "Urgent Pointer (0)"
  160-191: "(Options and Padding)"
  192-255: "Data (variable length)"
If the port is open the server will respond with something like (SYN-ACK):
packet-beta
  0-15: "Source Port (80)"
  16-31: "Destination Port (47921)"
  32-63: "Sequence Number (1)"
  64-95: "Acknowledgment Number (0)"
  96-99: "Data Offset (20)"
  100-103: "Reserved"
  104: ""
  105: ""
  106: ""
  107: "ACK"
  108: ""
  109: ""
  110: "SYN"
  111: ""
  112-127: "Window (1024)"
  128-143: "Checksum (0xaadd)"
  144-159: "Urgent Pointer (0)"
  160-191: "(Options and Padding)"
  192-255: "Data (variable length)"
This packet is requesting to open a TCP stream to port 80 on the target. You will notice the absence of IP addresses, or even MAC addresses, this is due to the fact TCP is on Layer 4 of the OSI model, IP addresses are Layer 3, and MAC addresses are Layer 2. As you move up/down the OSI model packets get encapsulated/de-encapsulated with different header information.
ffuf
We have the default Apache landing page but no login screen. I was promised Brute Forces, XSS and the like! What gives? Apache can serve sub-directories as webpages, for example the server was started at /var/www/html and there was a sub-directory it would show up in the URL.
Lets find this sub-directory using ffuf.
You must have an up to date distro!
If you get a warning about a signing key follow this guide https://www.kali.org/blog/new-kali-archive-signing-key/
First we must install the seclists and pencode with a little:
1
sudo apt install seclists
Golang needs to be installed:
1
sudo bash -c "rm -rf /usr/local/go && wget https://go.dev/dl/go1.24.3.linux-amd64.tar.gz && tar -C /usr/local -xzf go1.24.3.linux-amd64.tar.gz"
Then add it to your path:
1
echo 'export PATH="$PATH:/usr/local/go/bin"' >> ~/.zshrc && echo 'export PATH="$PATH:$HOME/go/bin"' >> ~/.zshrc && export PATH="$PATH:/usr/local/go/bin" && export PATH="$PATH:$HOME/go/bin"
Install pencode:
1
go install github.com/ffuf/pencode/cmd/pencode@latest
We can now run the ffuf scan:
1
ffuf -u "http://tartarus-dvwa.home.arpa/FUZZ" -mc 200 -r -w <(pencode -input /usr/share/wordlists/seclists/Fuzzing/1-4_all_letters_a-z.txt upper)
This will enumerate all 4 uppercase letter combination sub-directories under /, it’ll take less than 5 minutes to enumerate all ~475,000 combinations.
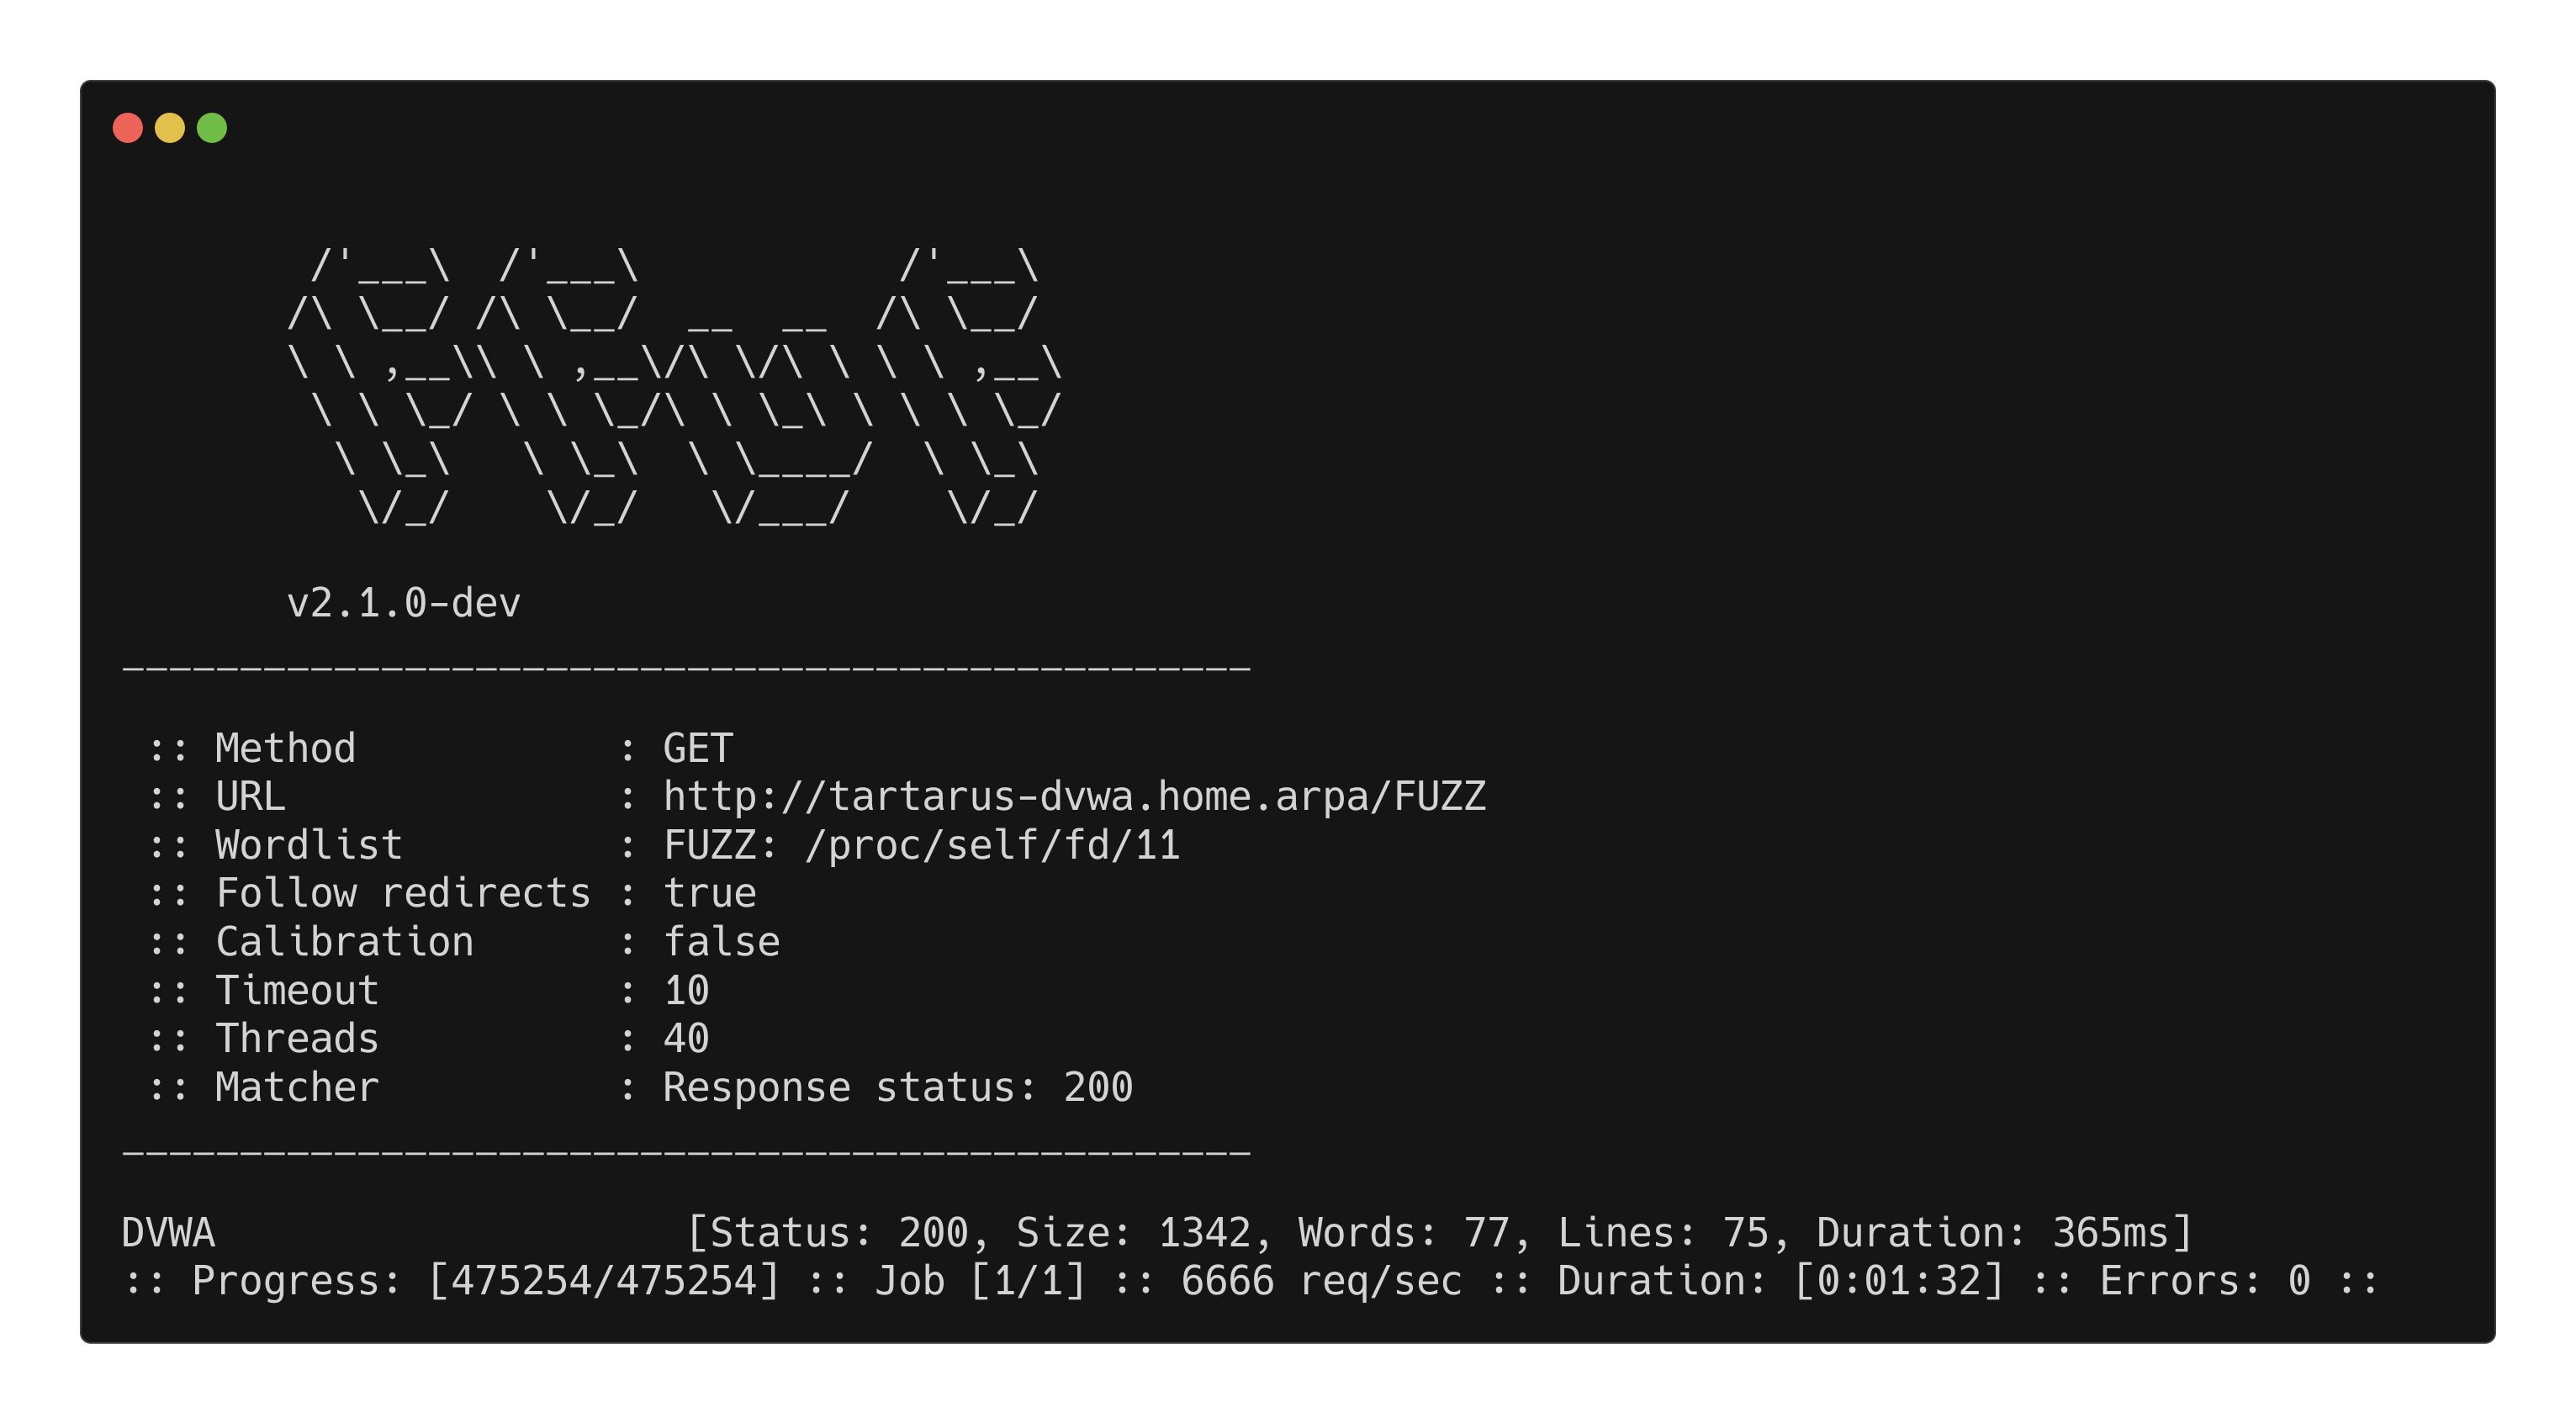 DVWA low sec ffuf landing page
Navigate to the directory:
1
http://tartarus-dvwa.home.arpa/DVWA/
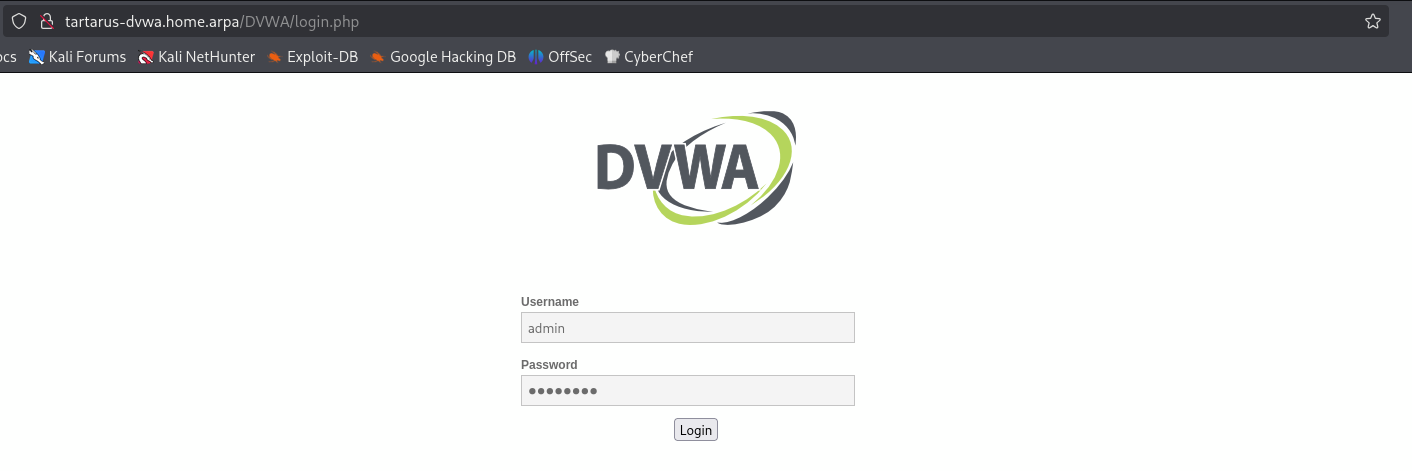
You should be redirected to a login page:
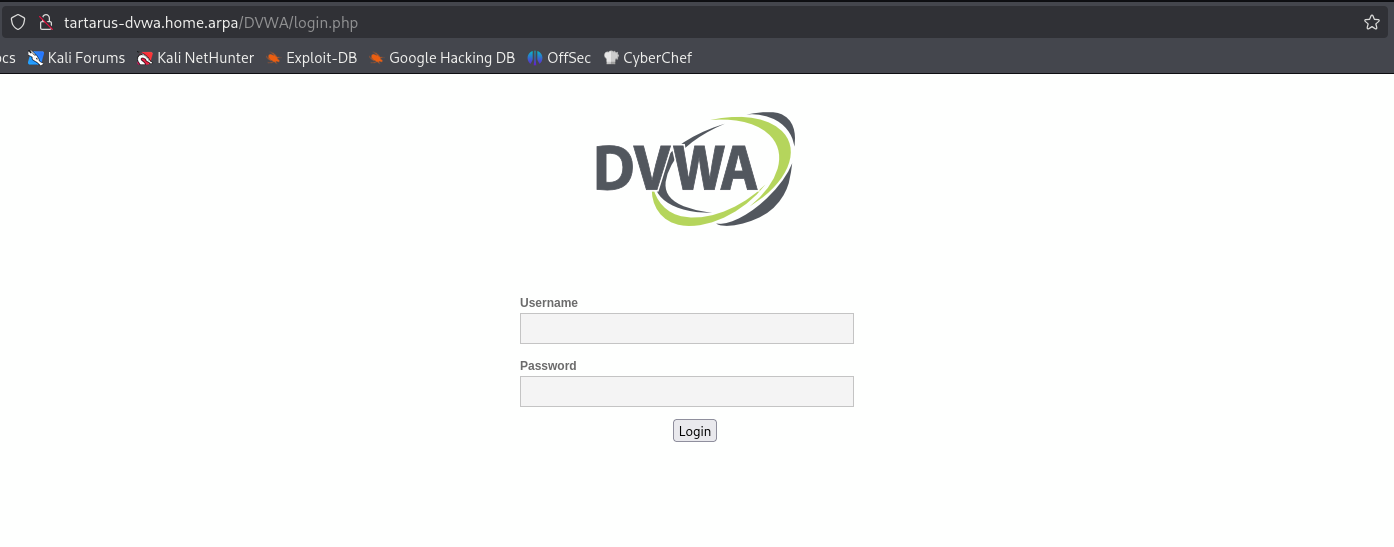 DVWA login page
Zed Attack Proxy
Another approach is to use the Zed Attack Proxy (Formally OWASP now Checkmarx) to spider the target.
Install zap with:
1
sudo apt install zaproxy
Start zap:
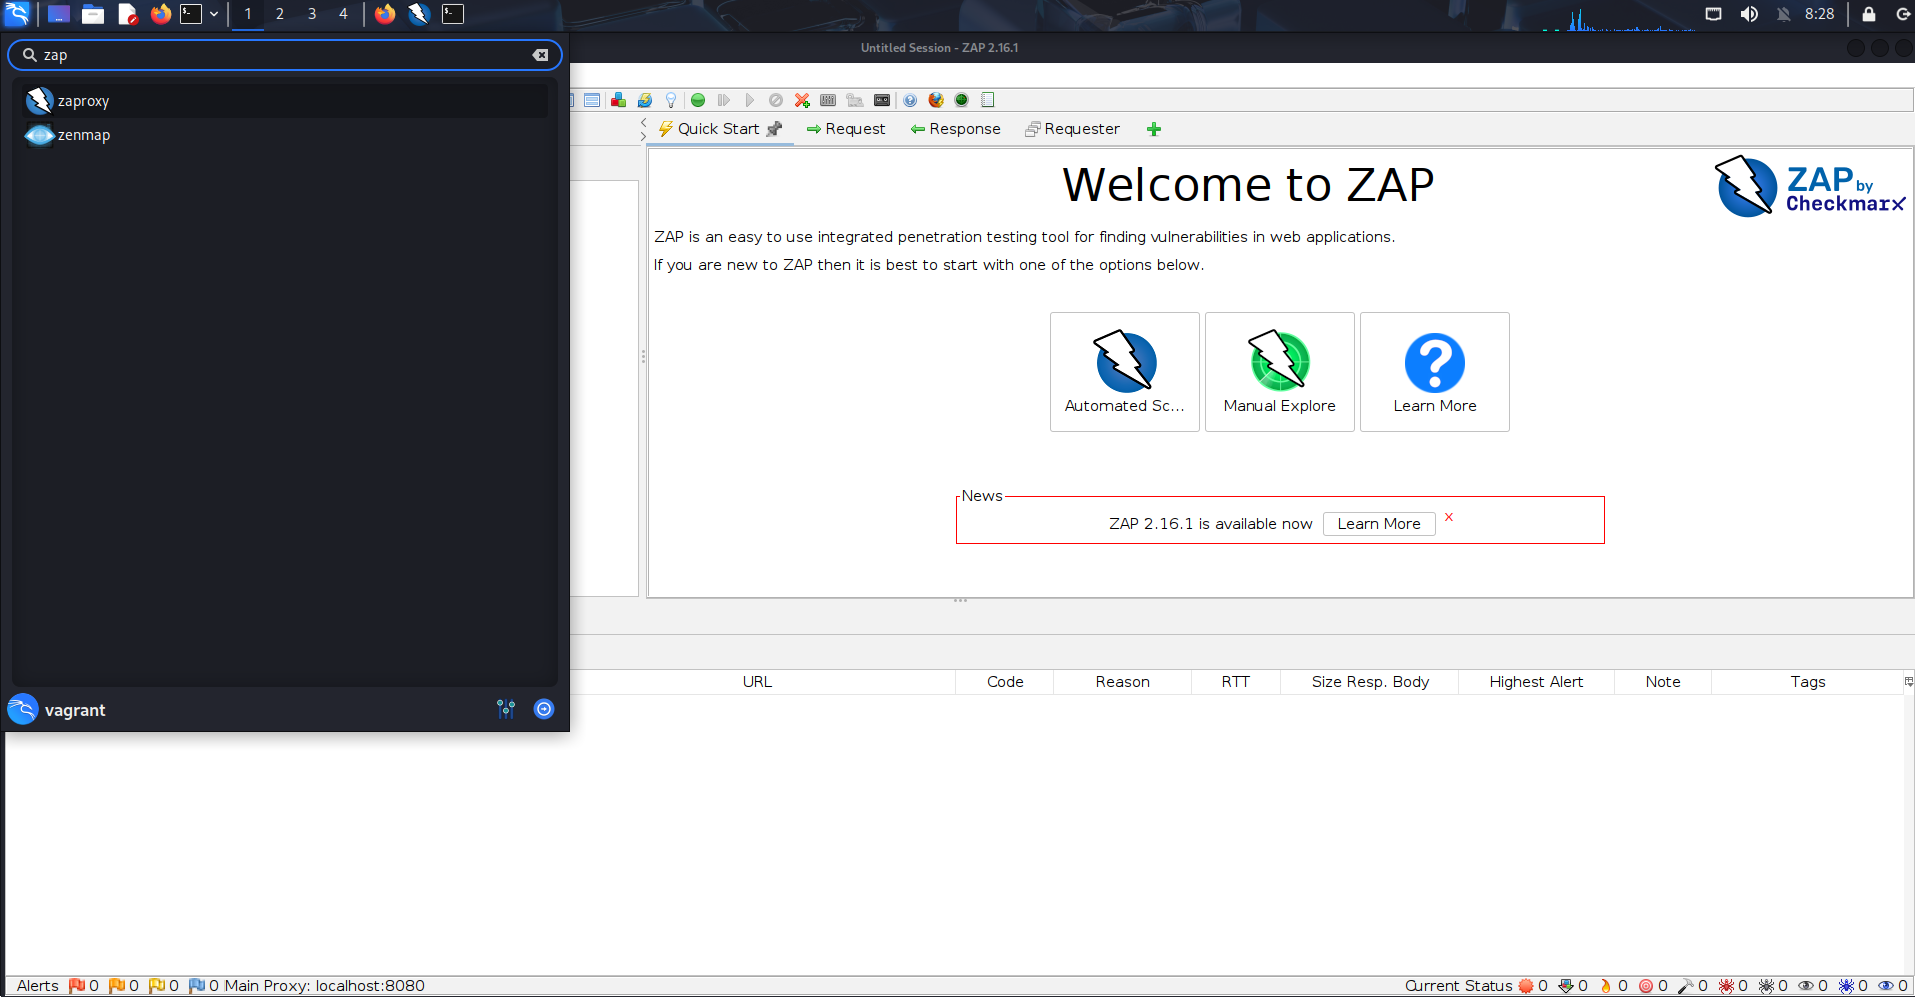 DVWA low recon zap start
Select the “Automated Scan” underneath “Welcome” input the target and click on “Attack”:
1
tartarus-dvwa.home.arpa
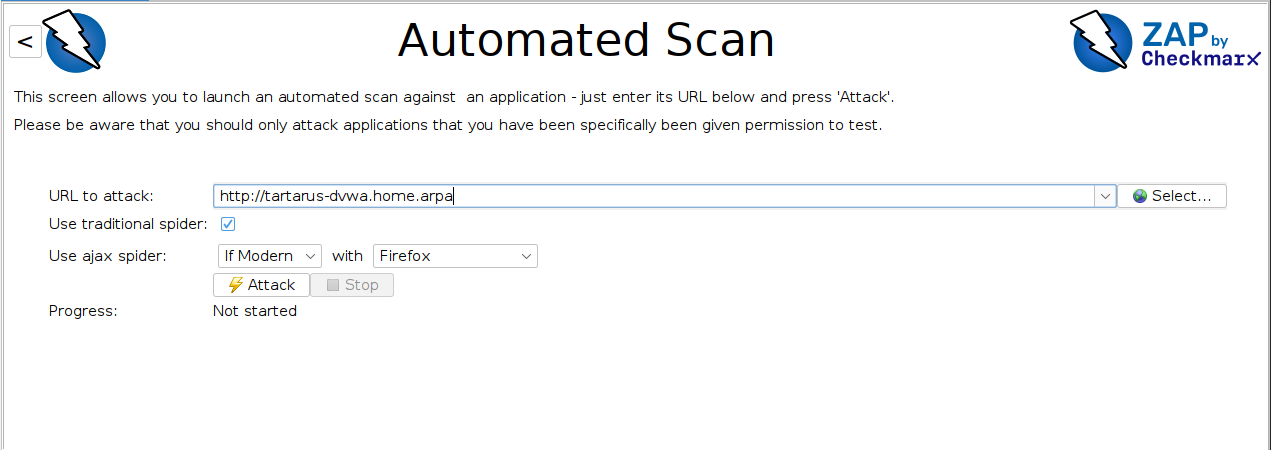 DVWA low recon zap scan
You should be redirected to the “Alerts” tab once the scan completes:
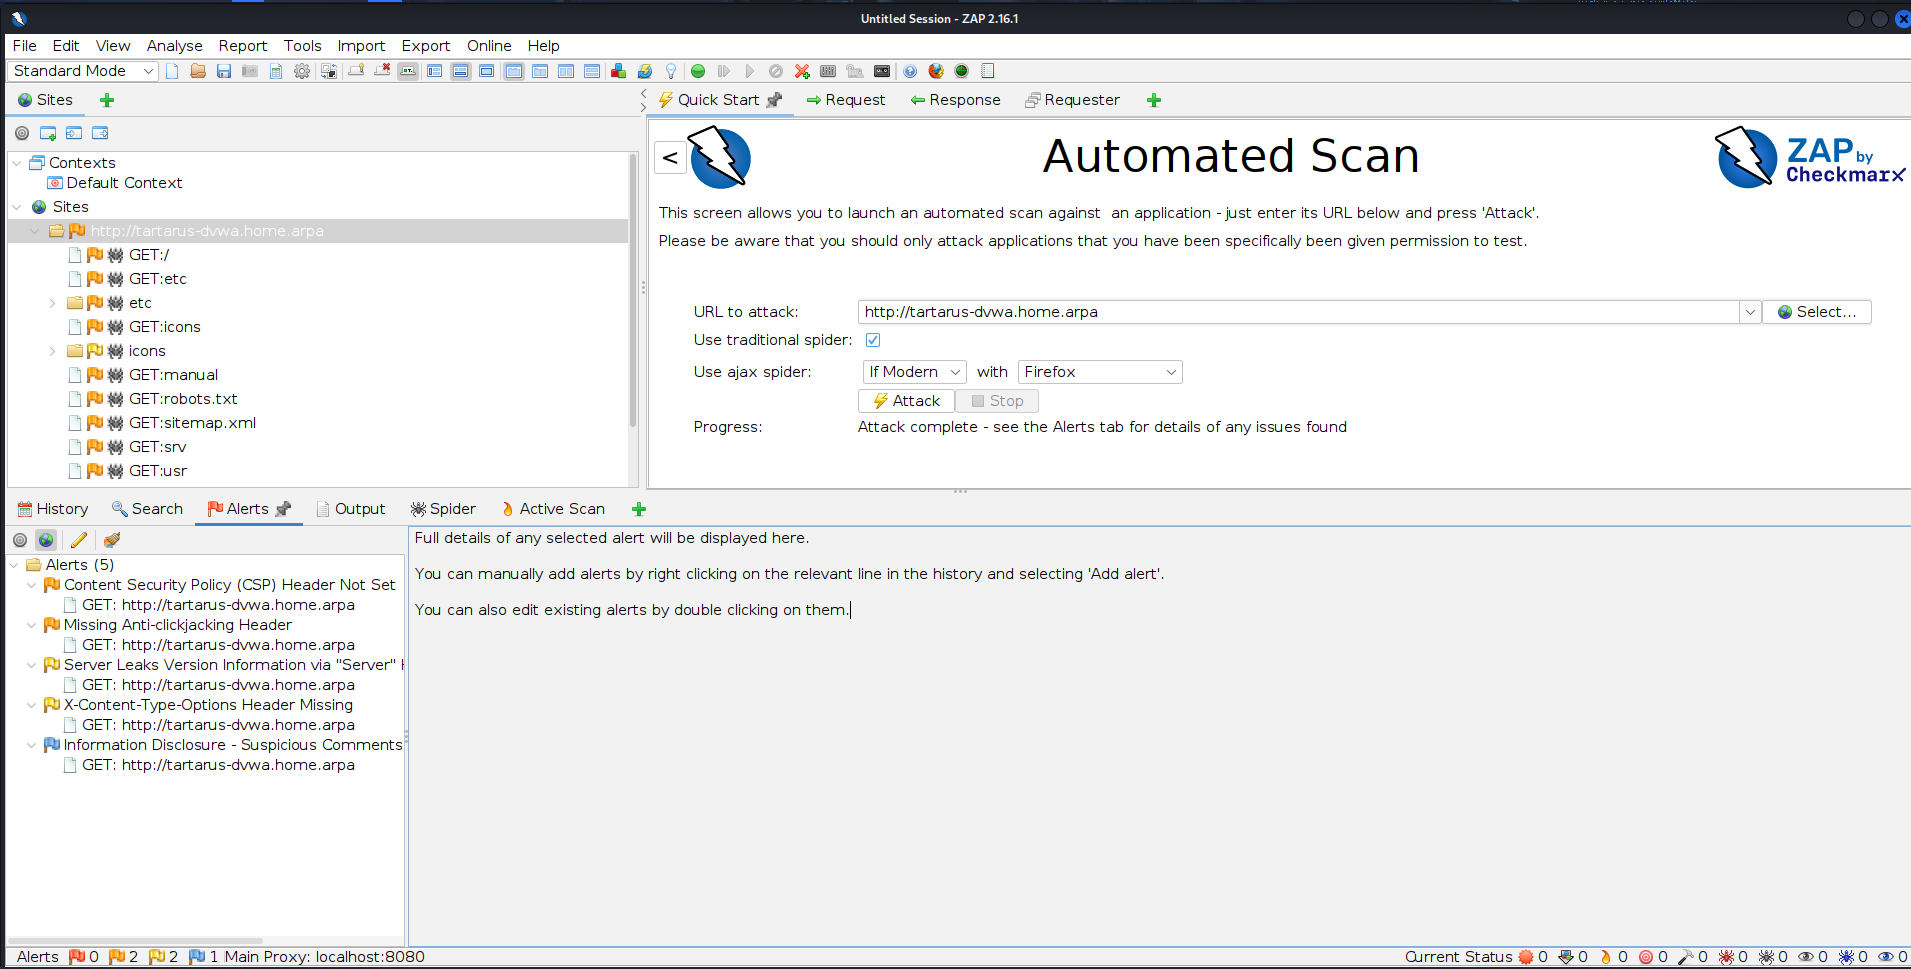 DVWA low recon zap alerts
Wow only 5 alerts, we can call it a day. Ez.
Not quite, lets try discover the sub-directory we know exists.
In the “Sites” window right click on the target and select “Attack -> Fuzz”:
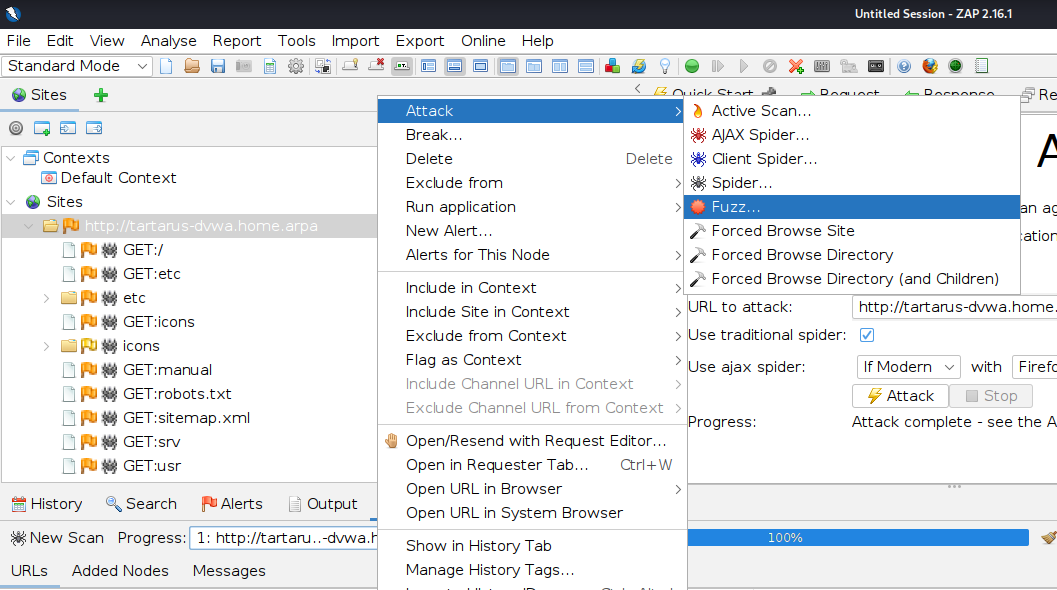 DVWA low recon zap fuzz start
In the new window select “Edit” and add the following to the URL:
1
/FUZZ
Once done click “Save”
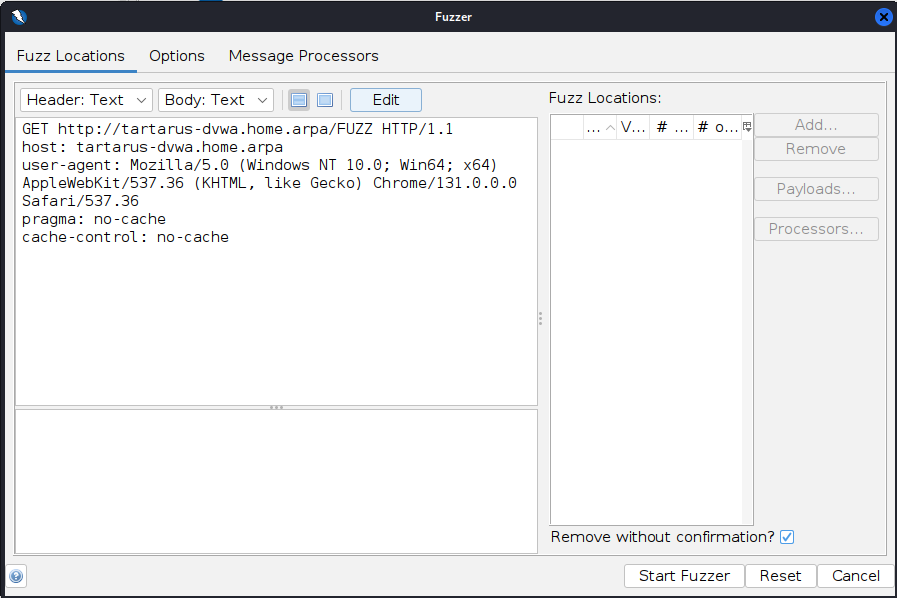 DVWA low recon zap fuzz edit
Now highlight the word “FUZZ” and add a location:
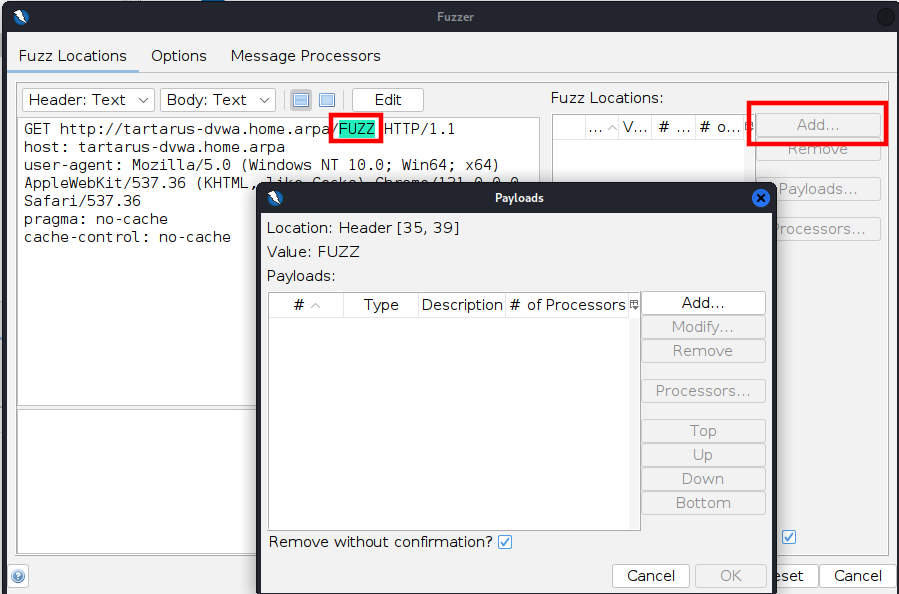 DVWA low recon zap fuzz set payload
Click “Add…” select “Type” as Regex and use the Regex [A-Z]{4} change the “Max. Payloads” to 456976 (26^4):
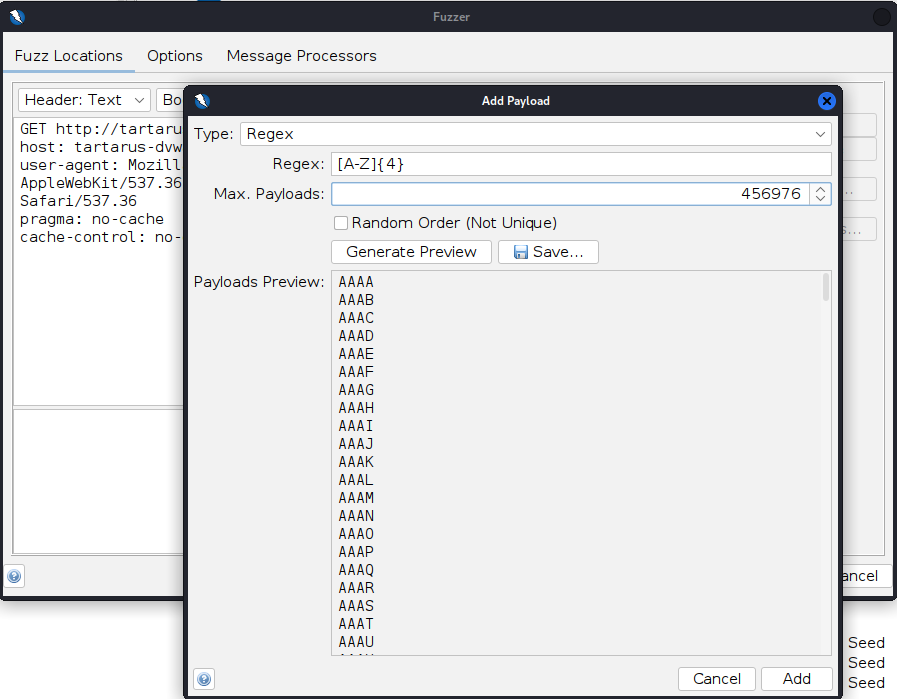 DVWA low recon zap create payload
The Regular Expression (Regex) “[A-Z]{4}” means all the letters from A to Z uppercase 4 times.
Click “Add” then “Ok” finally “Start Fuzzer”:
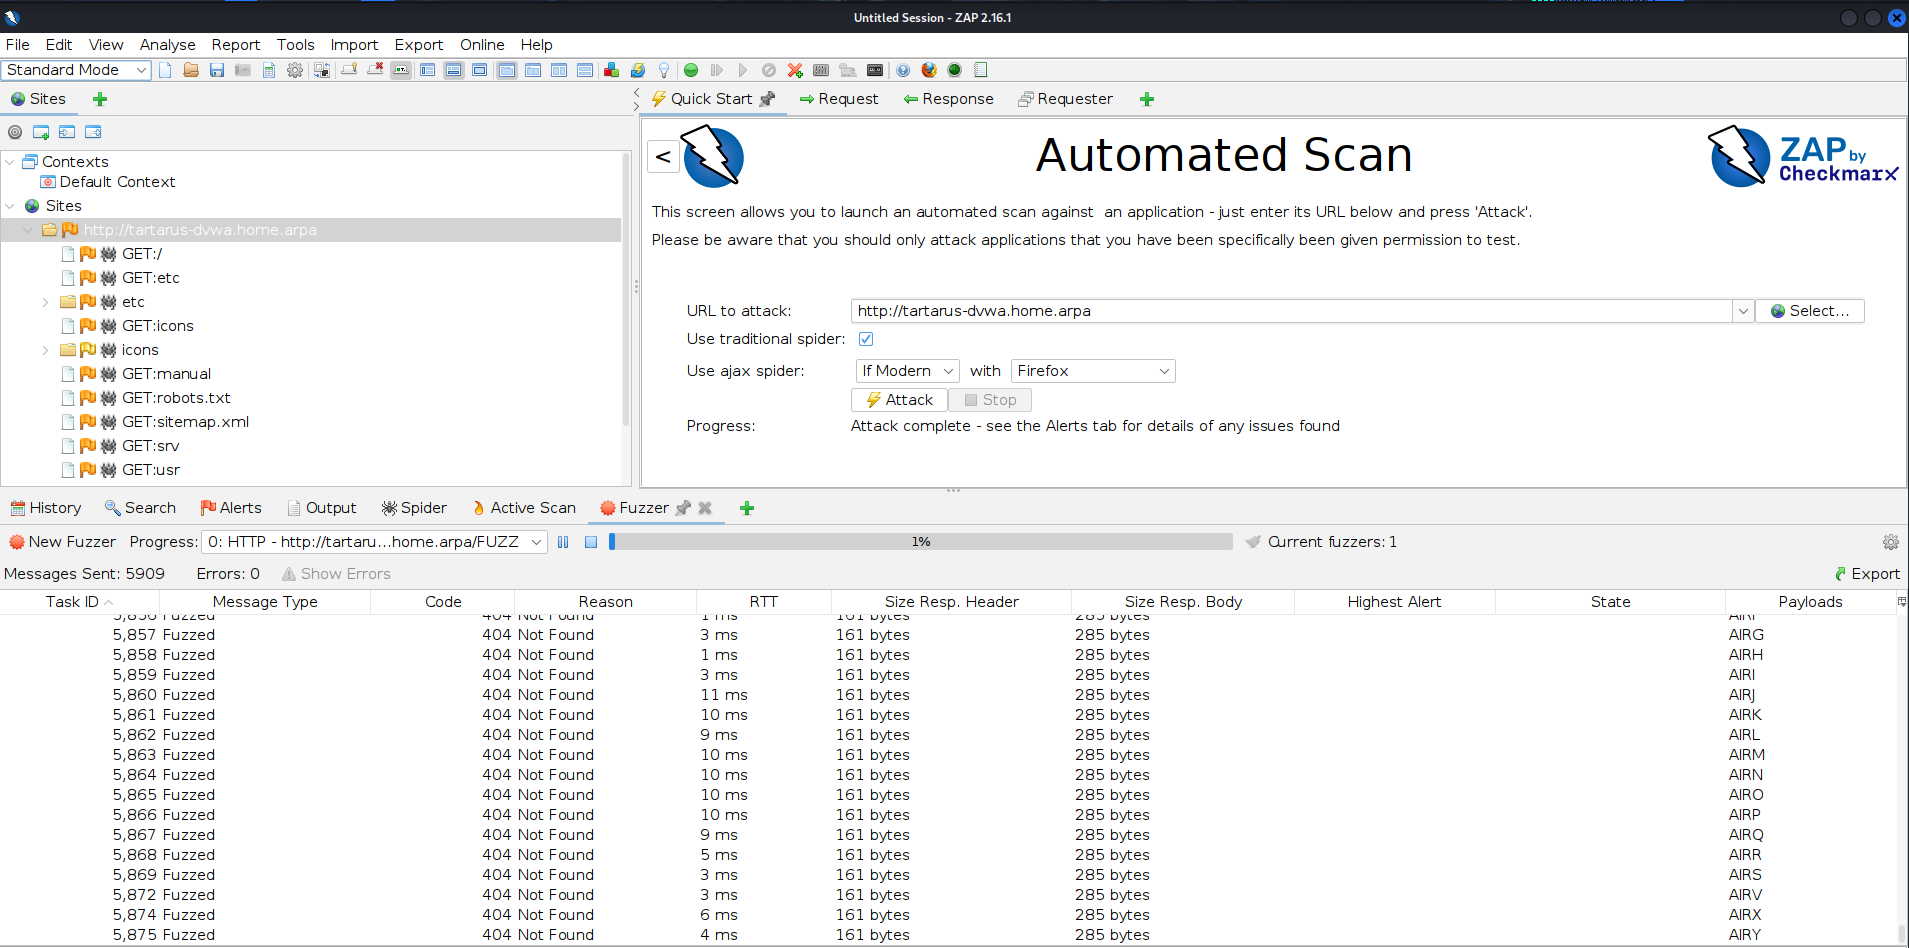 DVWA low recon zap fuzz progress
You can stop the scan about half way through, it will consume a lot of resources on the Kali guest and might become unstable.
Once the scan is started you’ll see the payloads fly by. When complete in the “Search” tab run the following (Set the drop-down to “HTTP Fuzzer Results”):
1
HTTP/1.1 20[1-9]|30[1-9]
This will regex search for all responses with the response “20X” or “30X”. 200 would mean an OK and 30X would mean a redirect, normally 301. More on HTTP codes and methods later.
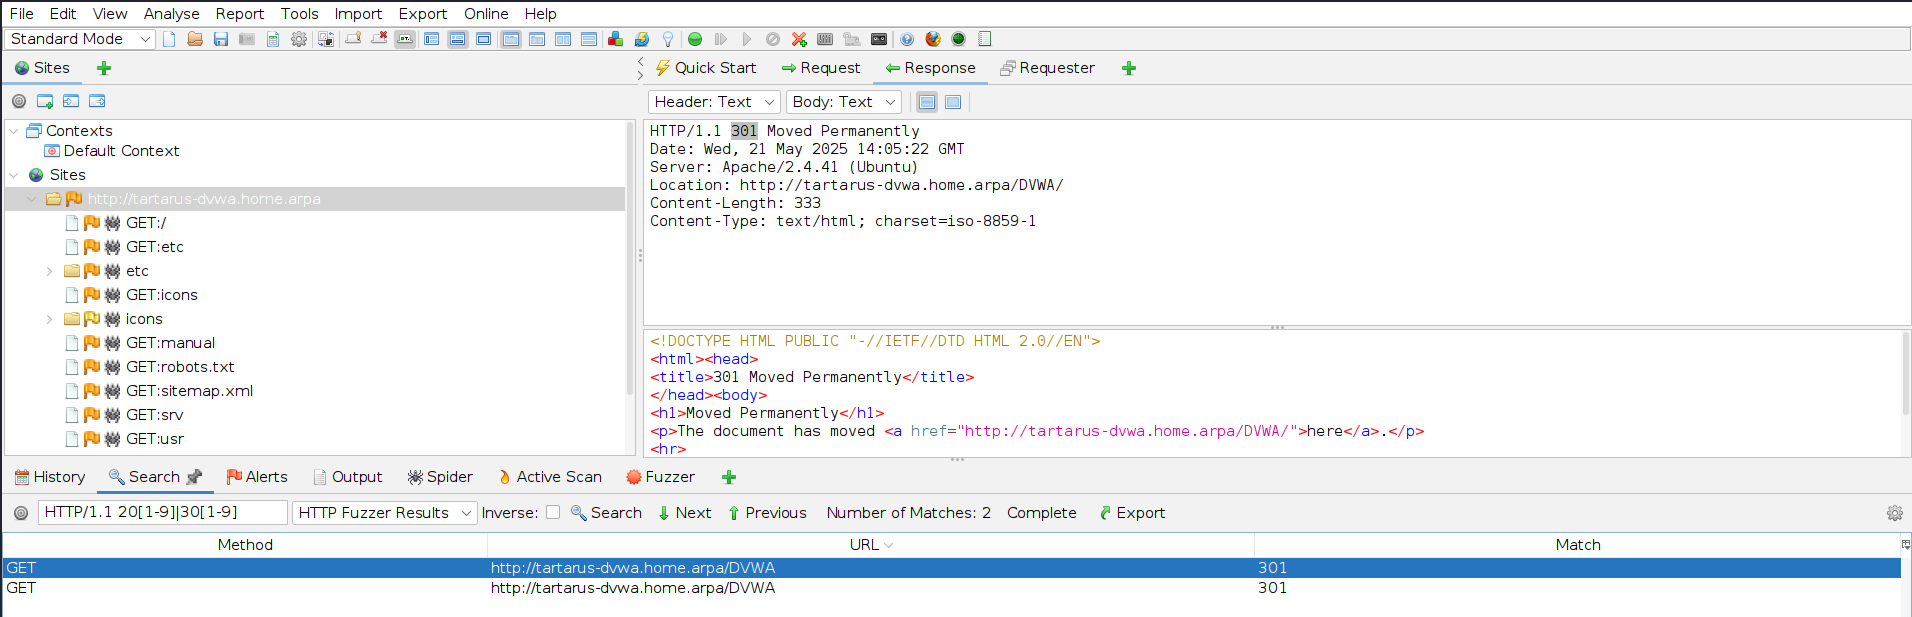 DVWA low recon zap fuzz done
Basic Browser
We have now found the sub-directory with two methods, lets login!
Open a browser to:
1
http://tartarus-dvwa.home.arpa/DVWA/
The credentials are:
Username: admin
Password: password
Very creative!
 DVWA low recon main page login
You can now set the difficulty to the appropriate level:
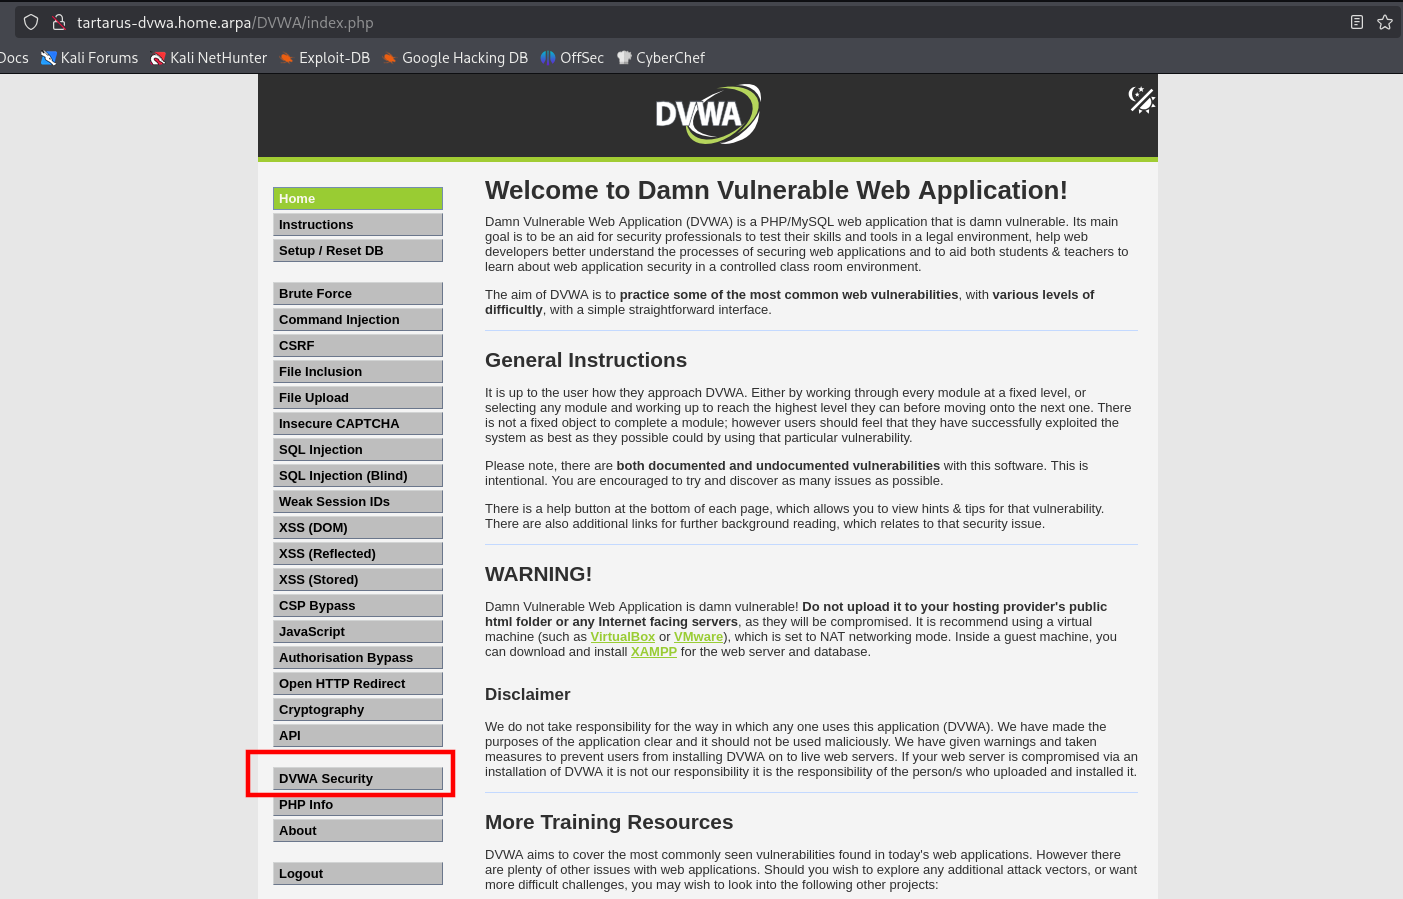 DVWA low recon main page set level
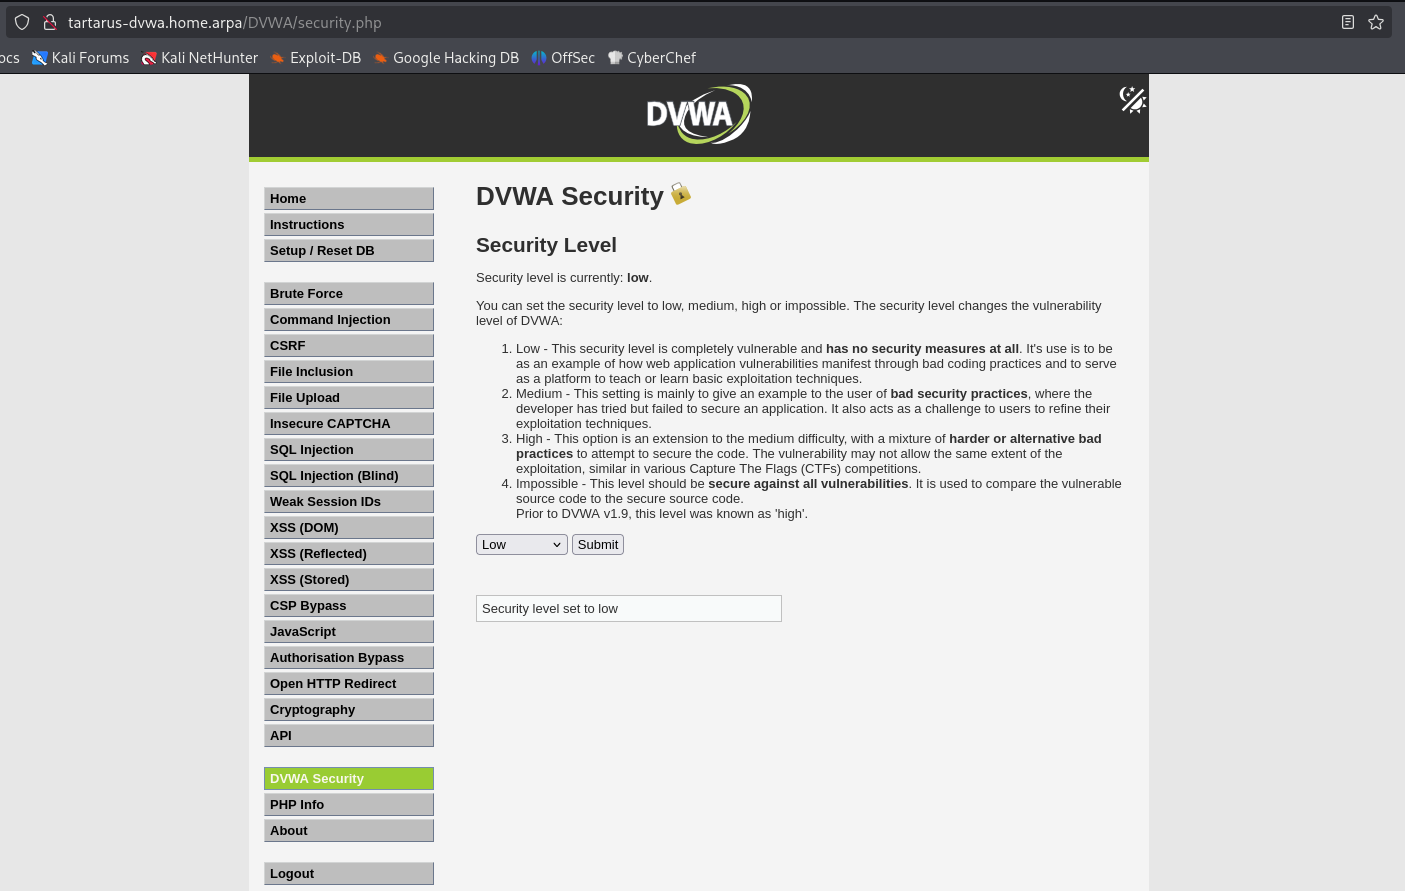 DVWA set sec level to low
Now we can see what we are dealing with. 18 challenges, the API one is new and we won’t be covering it at the moment due to the active development on it, we also won’t cover the insecure CAPTCHA as it requires external setup. So 15 challenges remain. Lets get going.
Challenges:
- Brute Force
- Command Injection
- CSRF
- File Inclustion
- File Upload
- SQL Injection
- SQL Injection (Blind)
- Weak Session IDs
- XSS (DOM)
- XSS (Reflected)
- XSS (Stored)
- CSP Bypass
- JavaScript
- Authorization Bypass
- Open HTTP Redirect
- Cryprtography
Recon Low Sec - Blue Team
How do we detect the recon attempts against the DVWA? Since the Tartarus Lab more closely emulates a “real” enterprise, we have access to firewall logs from the opnsense guest and Apache Access logs. We aren’t enabling Suricata in the low sec post.
Requirements
You must have used the Blue Team version Blue Team Setup.
Side Channel: A brief introduction to Elastic
The ELK/Elastic Stack, now just Elastic is a series of products that facilitate a SIEM use case:
- Elasticsearch
- Kibana
- Logstash (not used in Tartarus)
- Beats (not used in Tartarus)
- Elastic Agent
These are the main building blocks of Elastic, today you will interface most with the Kibana web interface, that gets it’s data from the Elasticsearch datastore. Elasticsearch is a data storage construct built on Apache Lucene, this is where all the logs get stored. Kibana is how the data is retrieved from Elasticsearch in a nice GUI way, since Elasticsearch is API first you could do almost everything we’ll do today by doing API calls against Elasticsearch. Logstash is a means to route data into Elasticsearch. Beats are agents that live on endpoints (Windows work stations, Linux hosts, etc) that collect and send log data to Elasticsearch. Last but not least the Elastic Agent the new way to collect data from endpoints, it can do what the Beats do and more. The Elastic Agent also has Endpoint Detection and Response (EDR) capabilities in the free version. If you dig into the deployment scripts you’ll see something like:
1
2
3
4
5
6
7
8
9
jq '.inputs[0].config.policy.value.windows.malware.mode = "detect" |
.inputs[0].config.policy.value.mac.malware.mode = "detect" |
.inputs[0].config.policy.value.linux.malware.mode = "detect"' /root/APACHELEDI_out.txt > /root/APACHELEDI_in.txt

# Update the Linux Elastic Defender Intigration to detect mode
curl --silent -XPUT "https://$DNS:$K_PORT_EXT/api/fleet/package_policies/$(cat /vagrant/keys/APACHELEDIid.txt)" \
  --cacert /vagrant/certs/root_ca.crt \
  --header @<(envsubst < /vagrant/config/sec_headers.txt) \
  --data @/root/APACHELEDI_in.txt > /dev/null
Here we’re telling the Elastic Agent EDR to only detect threats not prevent them.
Now that you have a 30,000 ft overview lets dive into Kibana.
You’ll need to add tartarus-elastic to your hosts host file.
- Windows (Administrator PowerShell window)
1
Add-Content 'C:\Windows\System32\Drivers\etc\hosts' "127.0.0.1 tartarus-elastic.home.arpa"
- Linux
1
sudo bash -c "echo '127.0.0.1 tartarus-elastic.home.arpa' >> /etc/hosts"
Now login by going to https://tartarus-elastic.home.arpa:5443/ on the host you ran vagrant up from.
You can log into Elastic from either Kali or your host.
From within Kali:
1
https://tartarus-elastic.home.arpa:5443/
From your host:
- Windows
Openpowershelland run it in administrator mode (in the start bar typepowershelland right click the icon and select run as administrator)
Now run this commandAdd-Content 'C:\Windows\System32\Drivers\etc\hosts' "127.0.0.1 tartarus-elastic.home.arpa"you can verify access withInvoke-WebRequest -Uri "https://tartarus-elastic.home.arpa:5443" -SkipCertificateCheckor just openhttps://tartarus-elastic.home.arpa:5443in your web browser. - Linux
Open aterminaland type the followingsudo bash -c "echo '127.0.0.1 tartarus-elastic.home.arpa' >> /etc/hosts"to add the DNS entry to your systems host file.
Verify access with a littlecurl -L -k https://tartarus-elastic.home.arpa:5443or accesshttps://tartarus-elastic.home.arpa:5443in your web browser.
Again username: elastic password: (printed to the terminal you ran vagrant up from)
Once you log in you should be presented with the following:
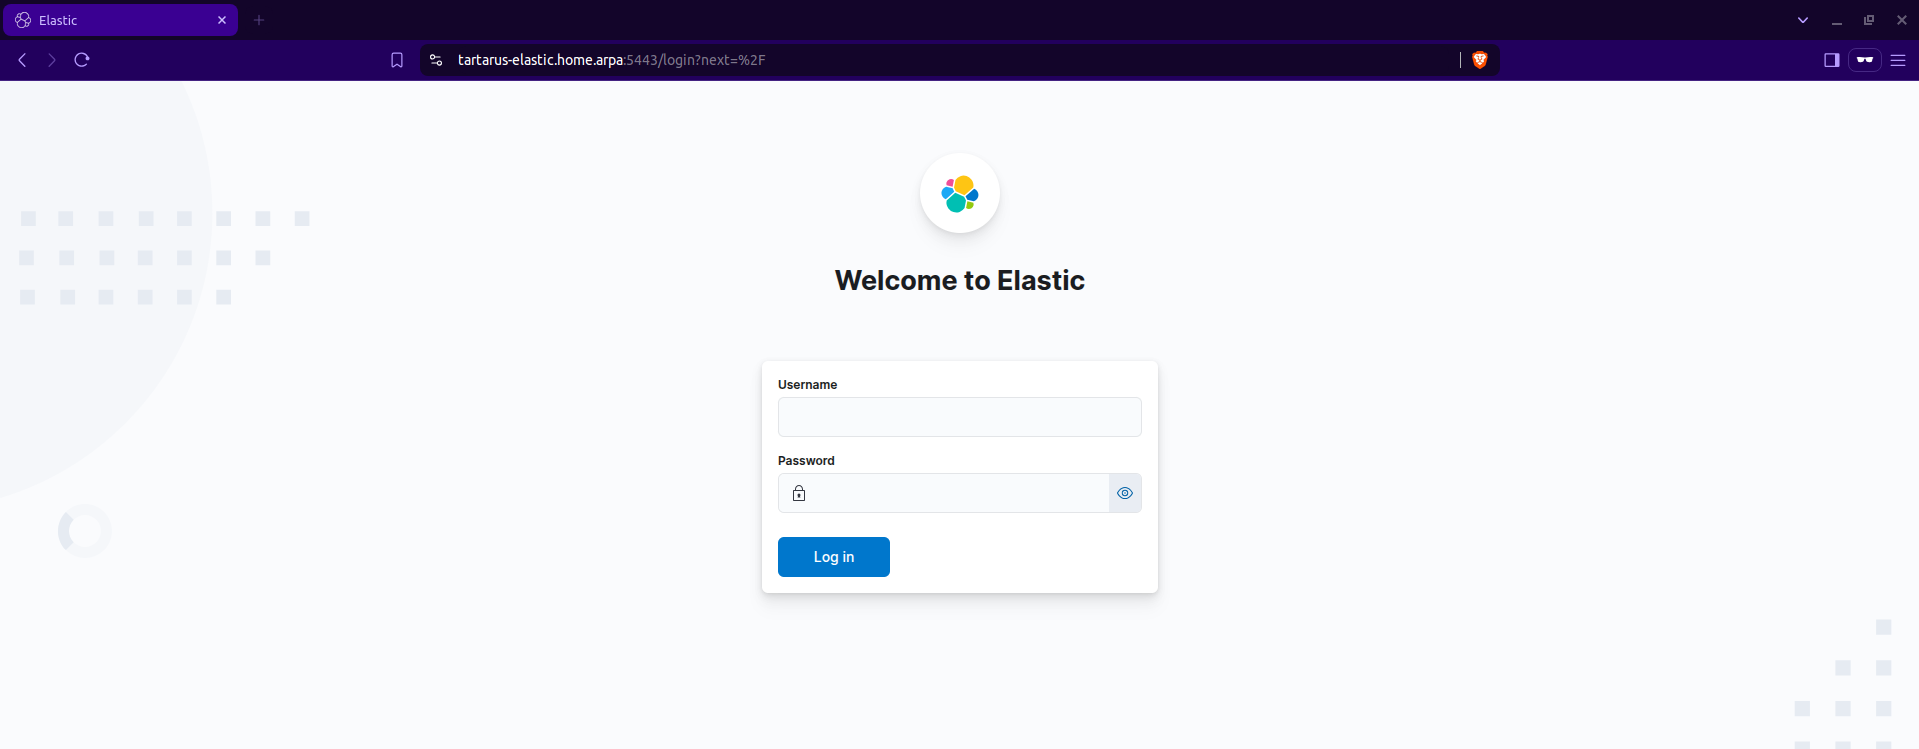 Elastic login screen
Once logged in you’ll see:
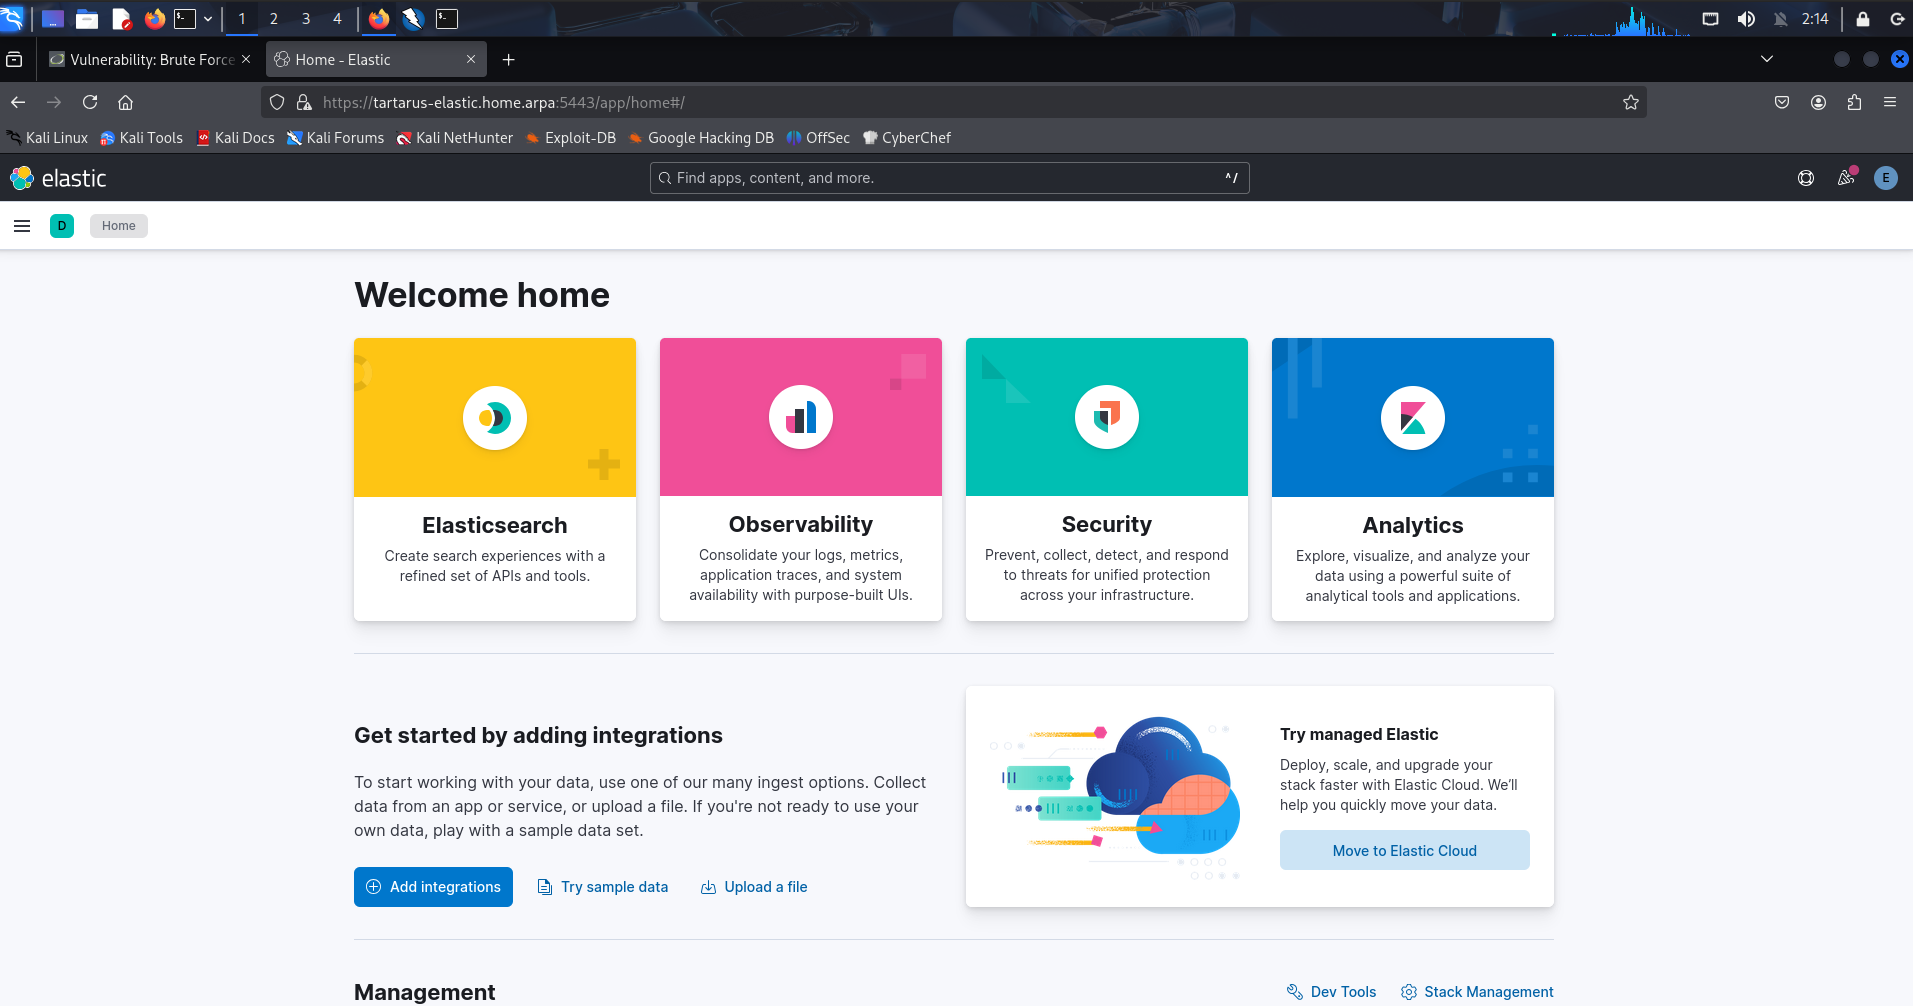 Elastic logged in
If you didn’t catch the elastic password you can reset it! From the terminal you ran
vagrant upfrom.
Nmap
The opnsense firewall data is configured with the following scripts:
- ESBootstrap.sh
1
2
3
4
5
6
curl --silent -XPOST \
--output /root/OPid.txt \
--cacert /vagrant/certs/root_ca.crt \
--url "https://$DNS:$K_PORT_EXT/api/fleet/package_policies" \
--header @<(envsubst < /vagrant/config/auth_headers.txt) \
--data @<(envsubst < /vagrant/config/opnsense_integration_add.json)
- firewall.php
1
2
3
4
foreach ($syslog as $syslog) {
  $response = makeOpnsenseRequest("syslog/settings/addDestination", ["destination" => $syslog], $api_key, $api_secret);
  echo "Response: " . json_encode($response) . "\n";
}
In the Kali guest open a terminal and run the following:
1
sudo nmap -vvv -A -sS -p- tartarus-dvwa.home.arpa
 Nmap Scan Output
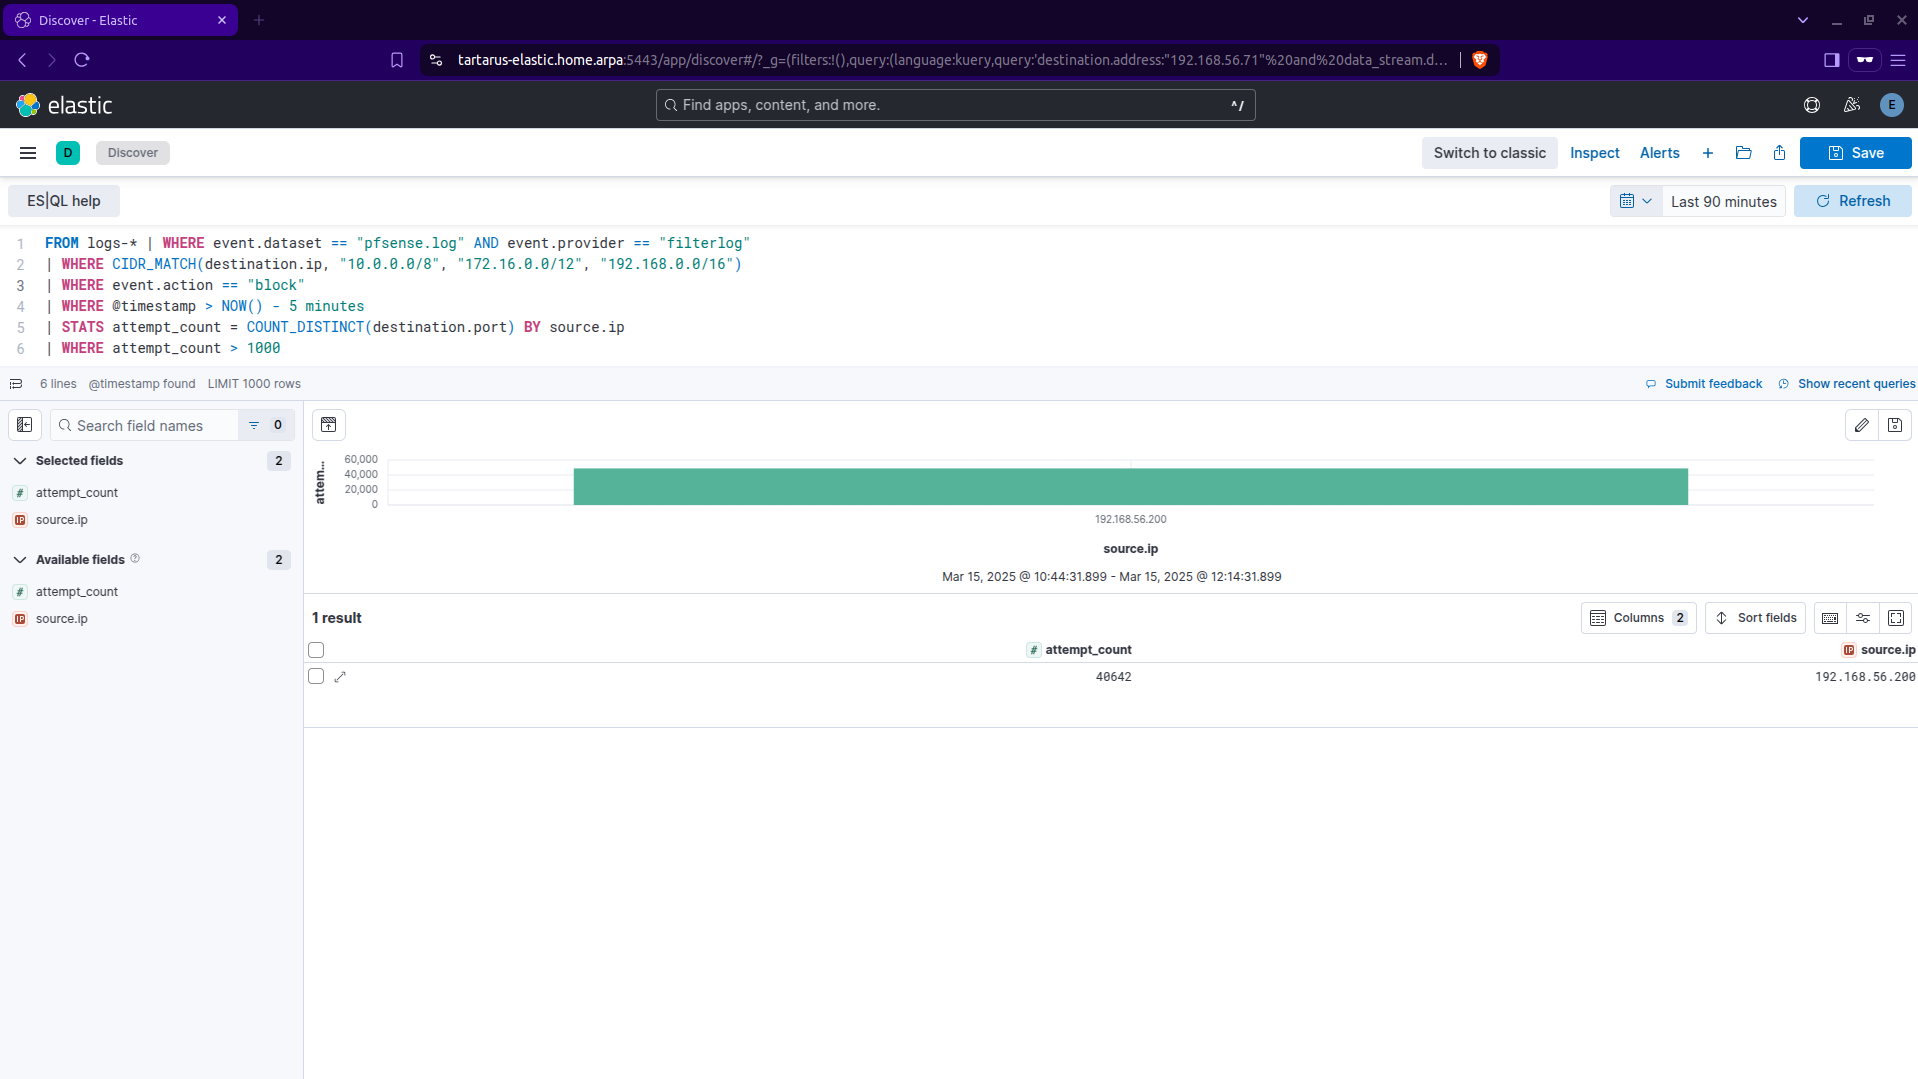
Lets see what it looks like in Kibana navigate to the Discover tab:
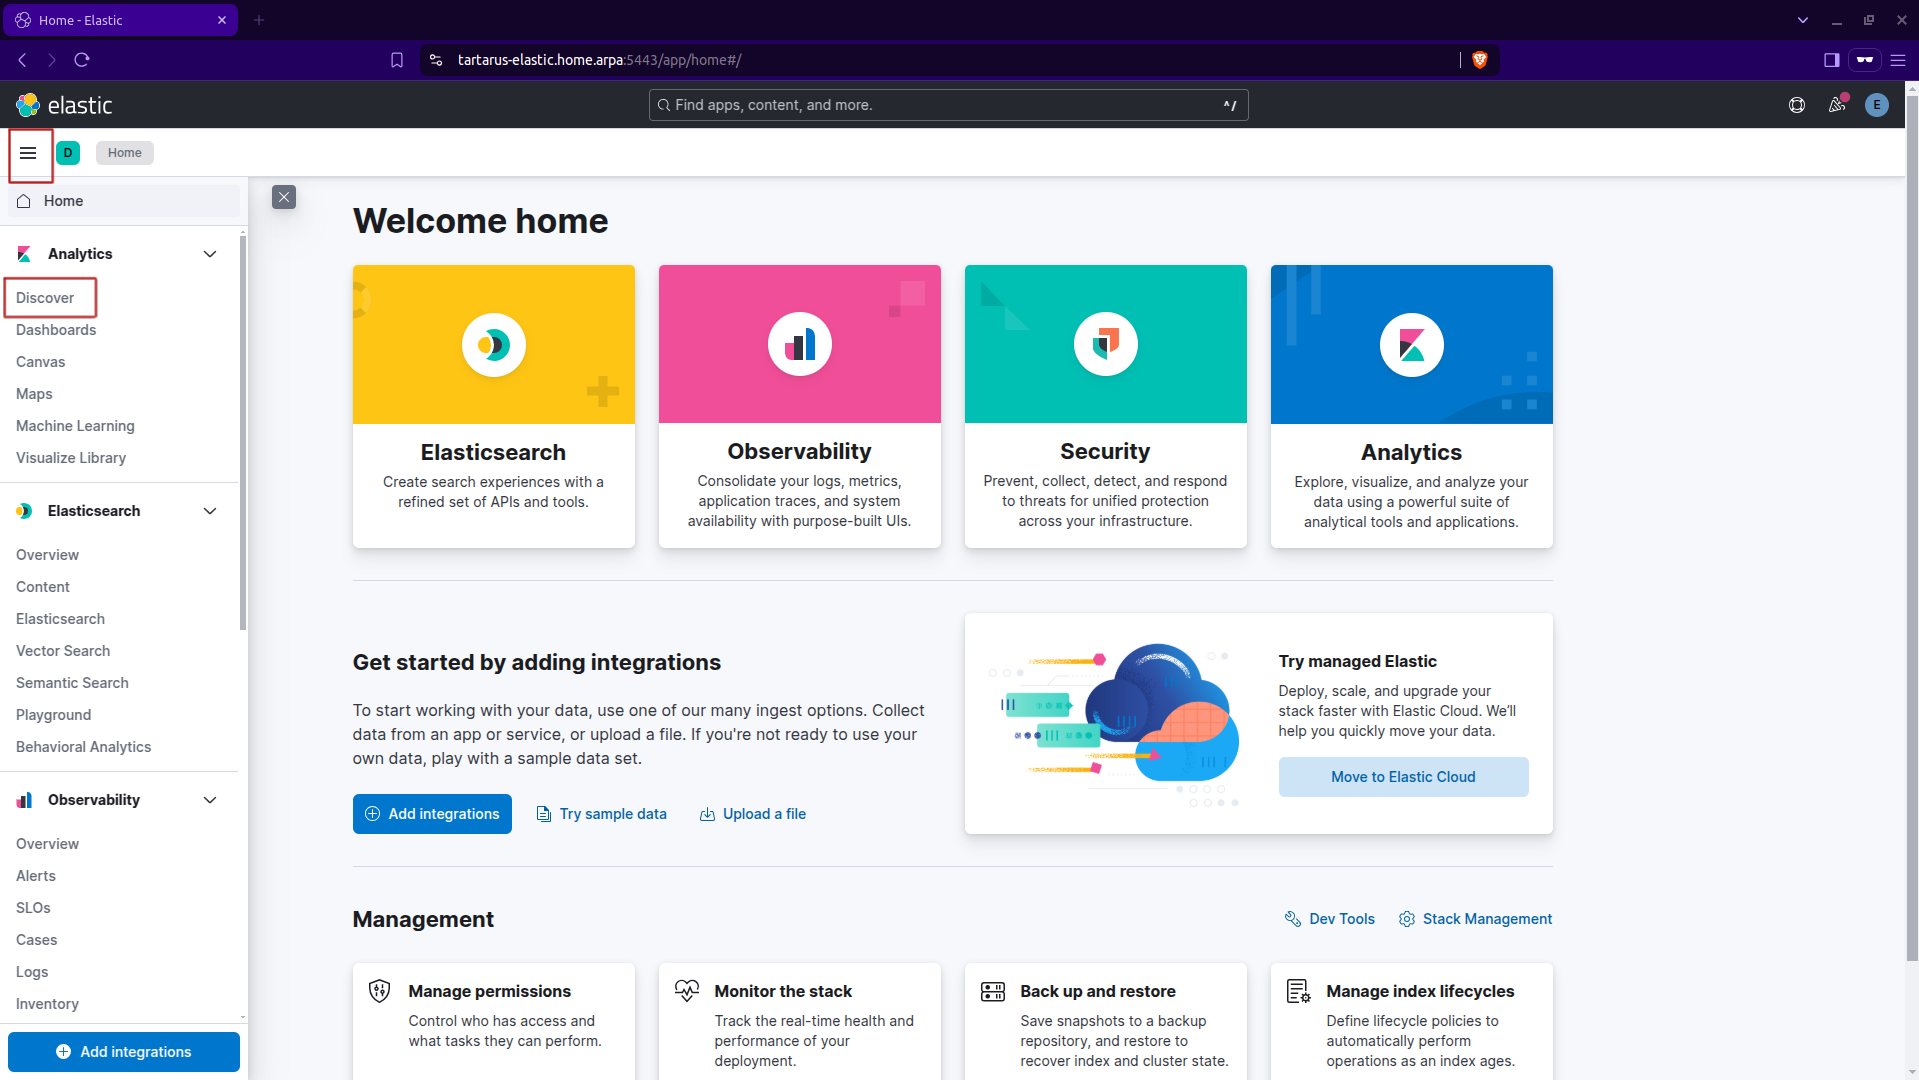 Kibana discover tab location in burger menu
You will see an increase in the total volume of logs, this is due to the implicit default deny firewall rule (since we only allow port 80 and 443 to get from the Hackers zone, where Kali is to the Assets zone, where DVWA is):
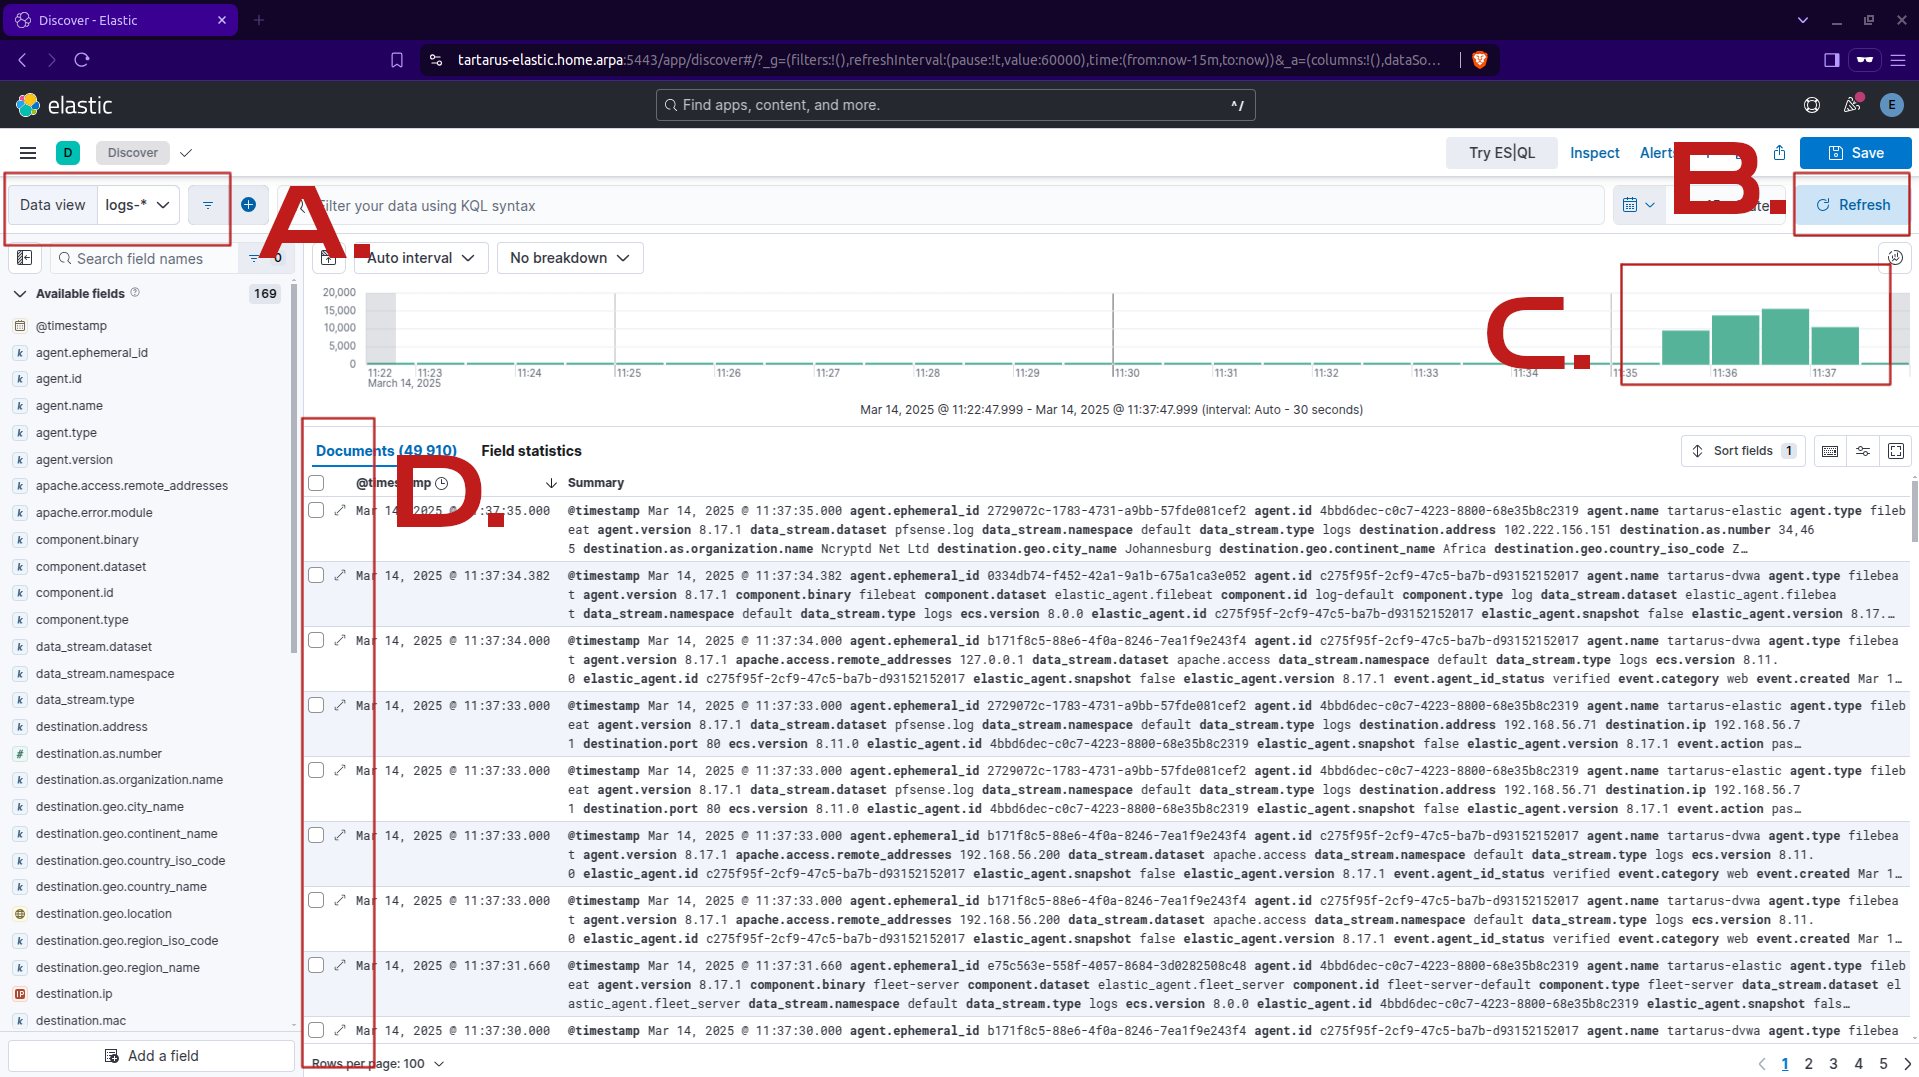 Kibana discover tab
A. You must select the logs-* index
B. You will need to refresh the view to load new data.
C. Here you can see the spike in traffic.
D. If you want to view an event in detail click on the two arrows going away from each other.
If you don’t see anything the default time window is the last 15 minutes so either do the nmap scan again or change the time window (it’s under the B char in the above screenshot).
A small note the log source is called pfsense... this is due to the fact that Opnsense is a fork of pfSense.
Lets apply some filters to get a clearer picture of what happened:
1
destination.address:"192.168.56.71" and data_stream.dataset :"pfsense.log"
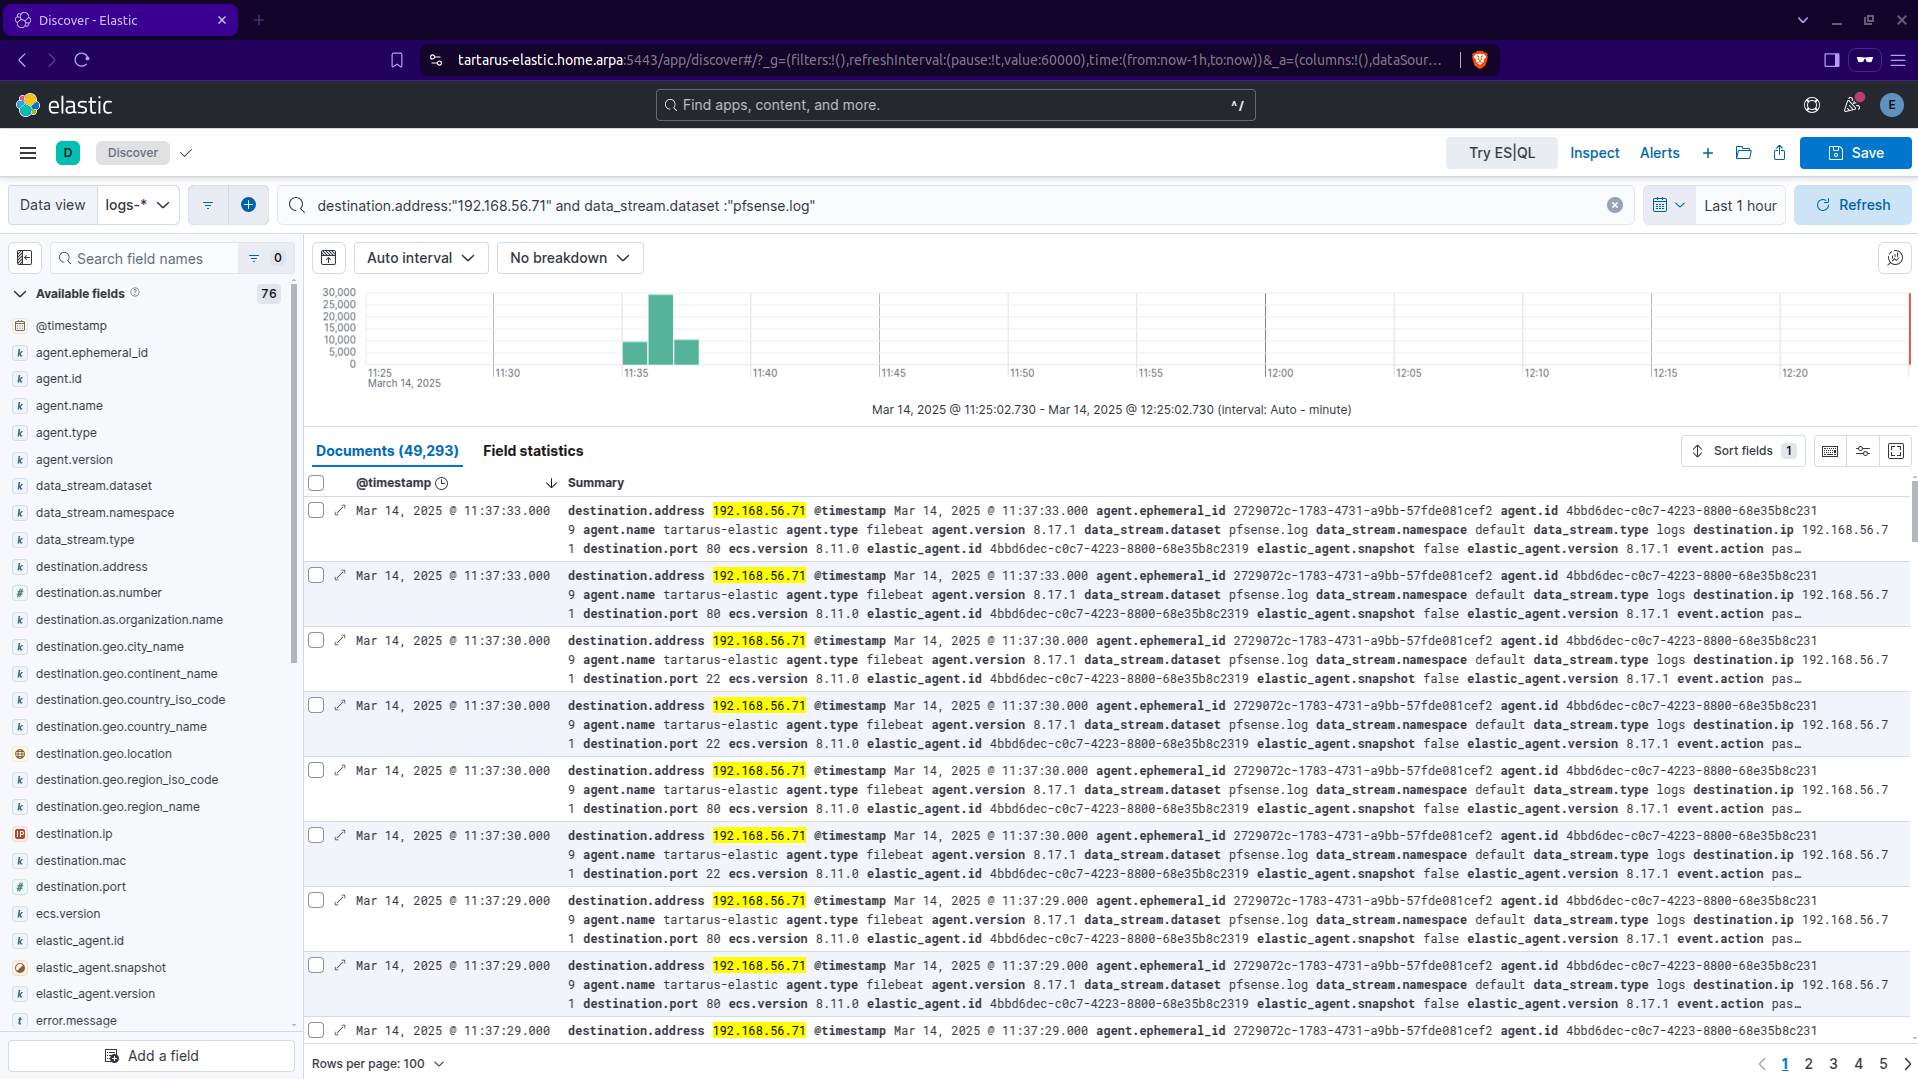 Kibana filter for opnsense logs
If we wanted to get a breakdown of how may of these where blocked vs allowed we can do it in a “visualisation”, click the button that looks like:
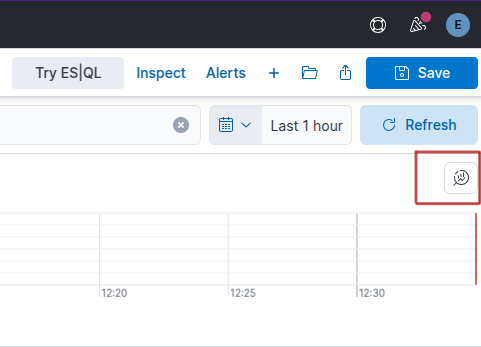 Kibana visualisation button
This will open the visualisation page with the filters:
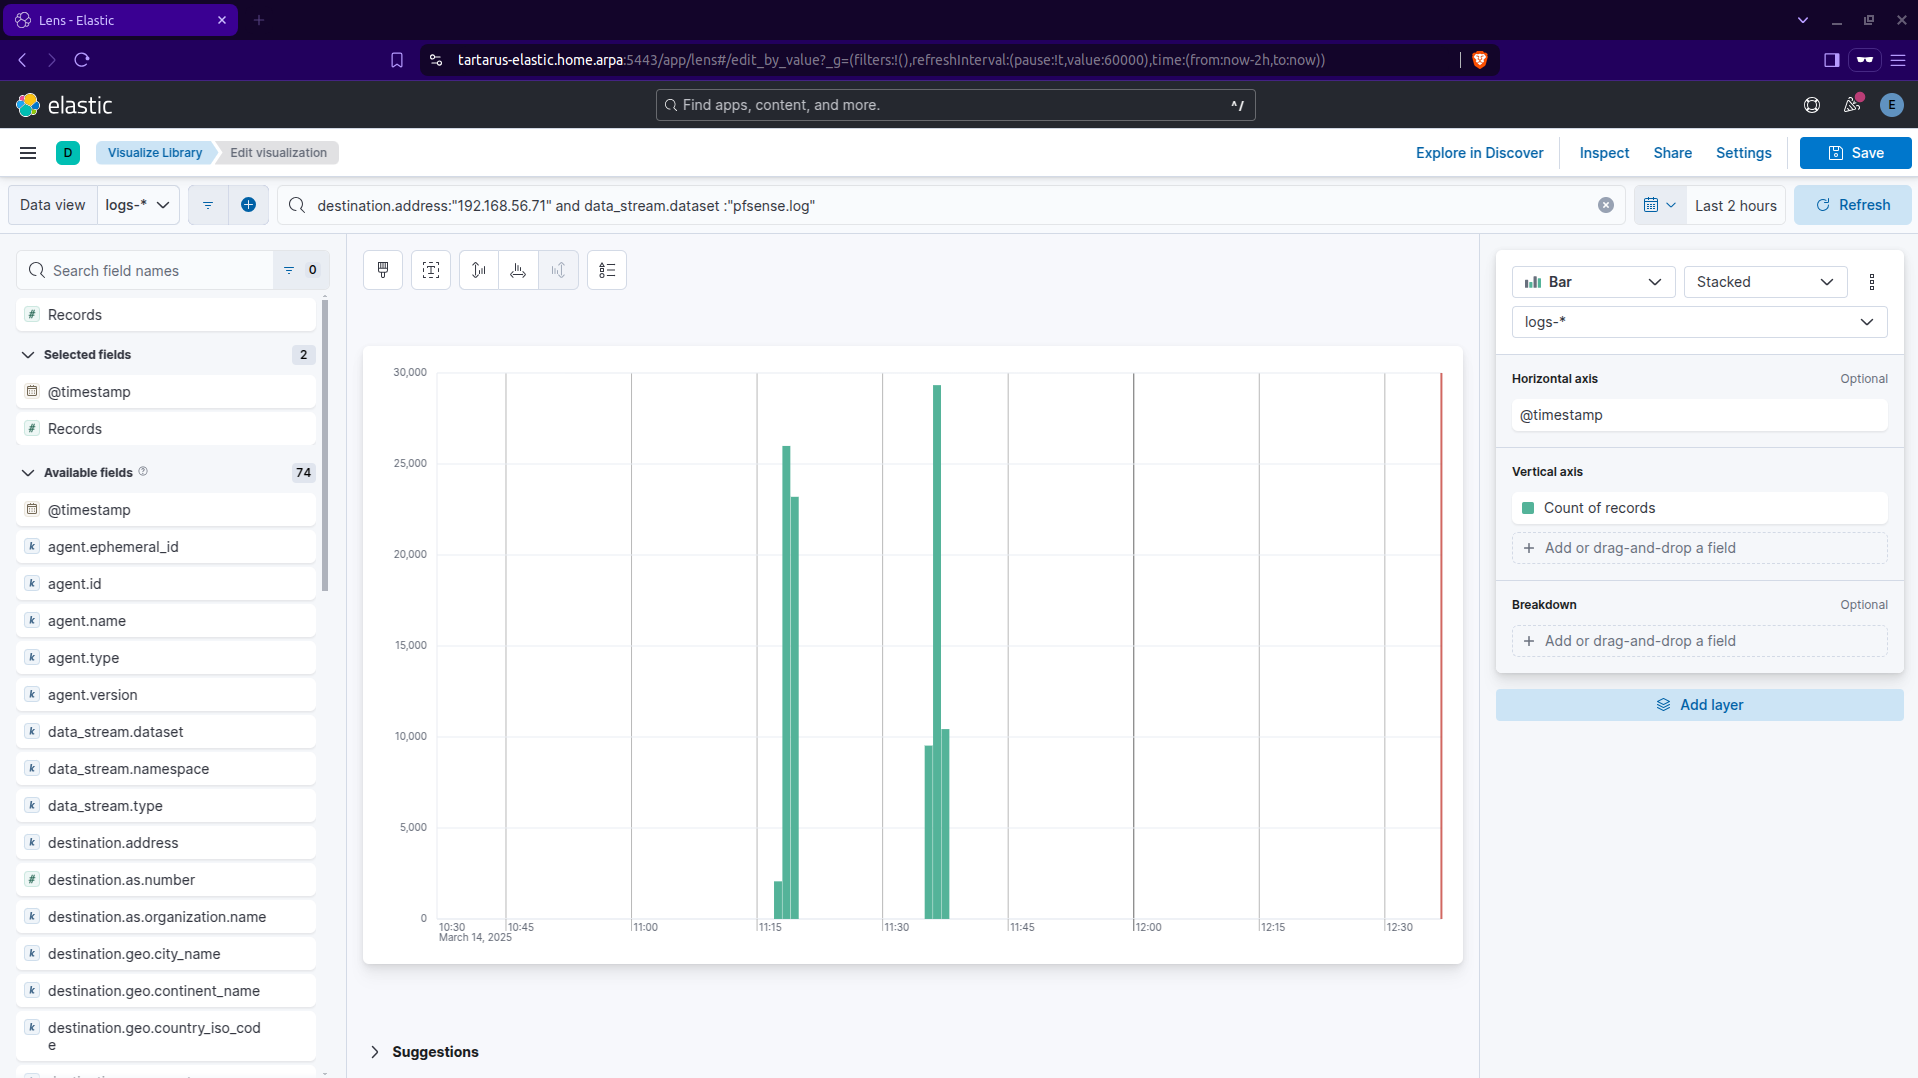 Kibana visualisation main page
Now we can select the type of visualisation:
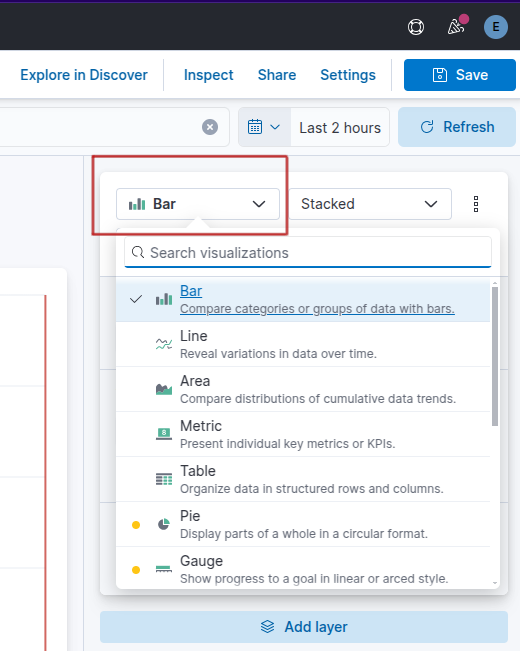 Kibana visualisation type select
Click on the “Metric” type:
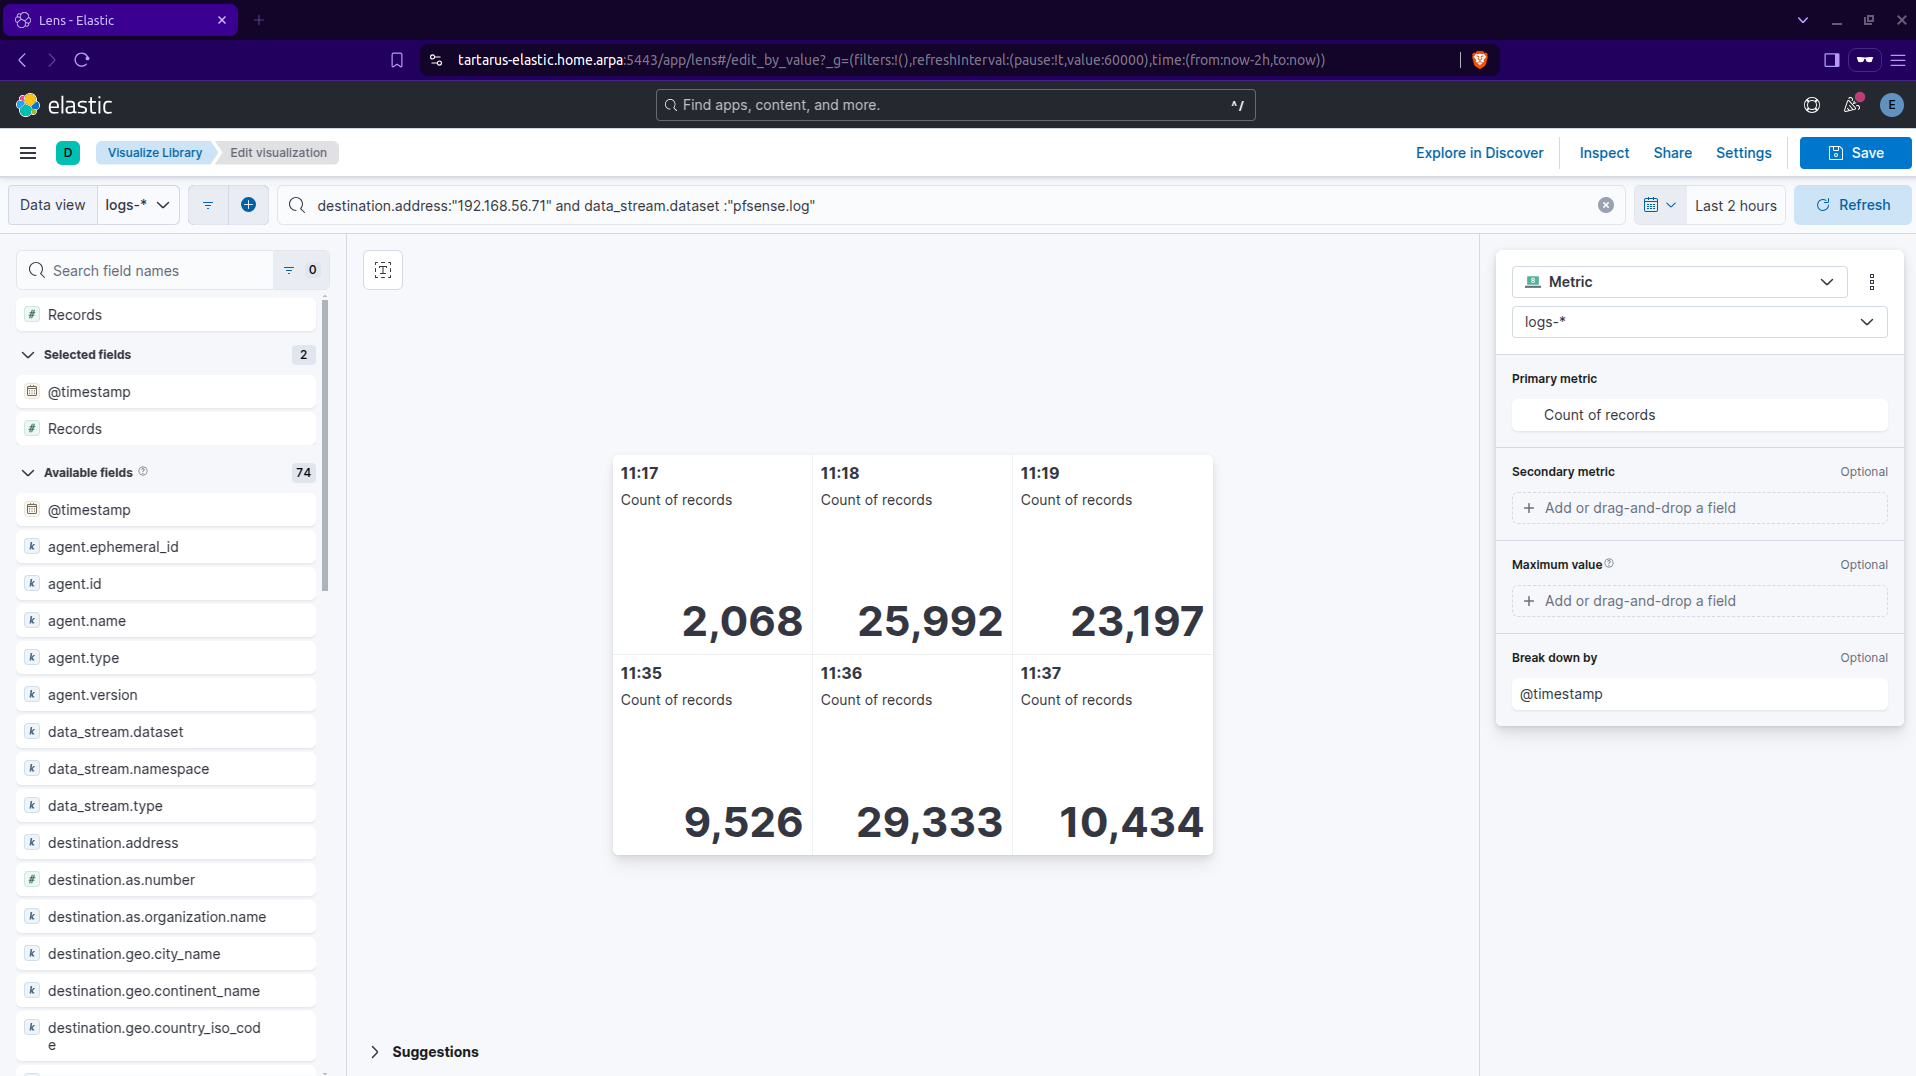 Kibana visualisation metric type
By defualt the events will be bucketed by the @timestamp field. We’re going to change that to be by event.action. Click on the “Break down by” in the right-hand side:
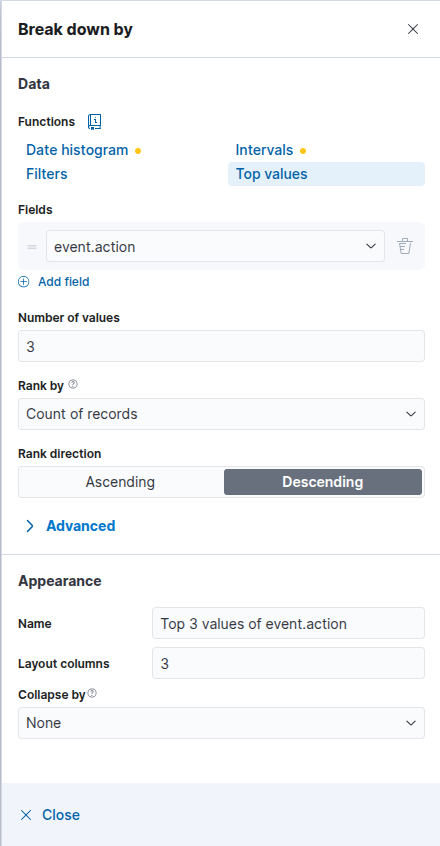 Kibana break down by
Make it look like the above, click ‘Top values’ and change the ‘Fields’ to be event.action. You will see it update to look something like:
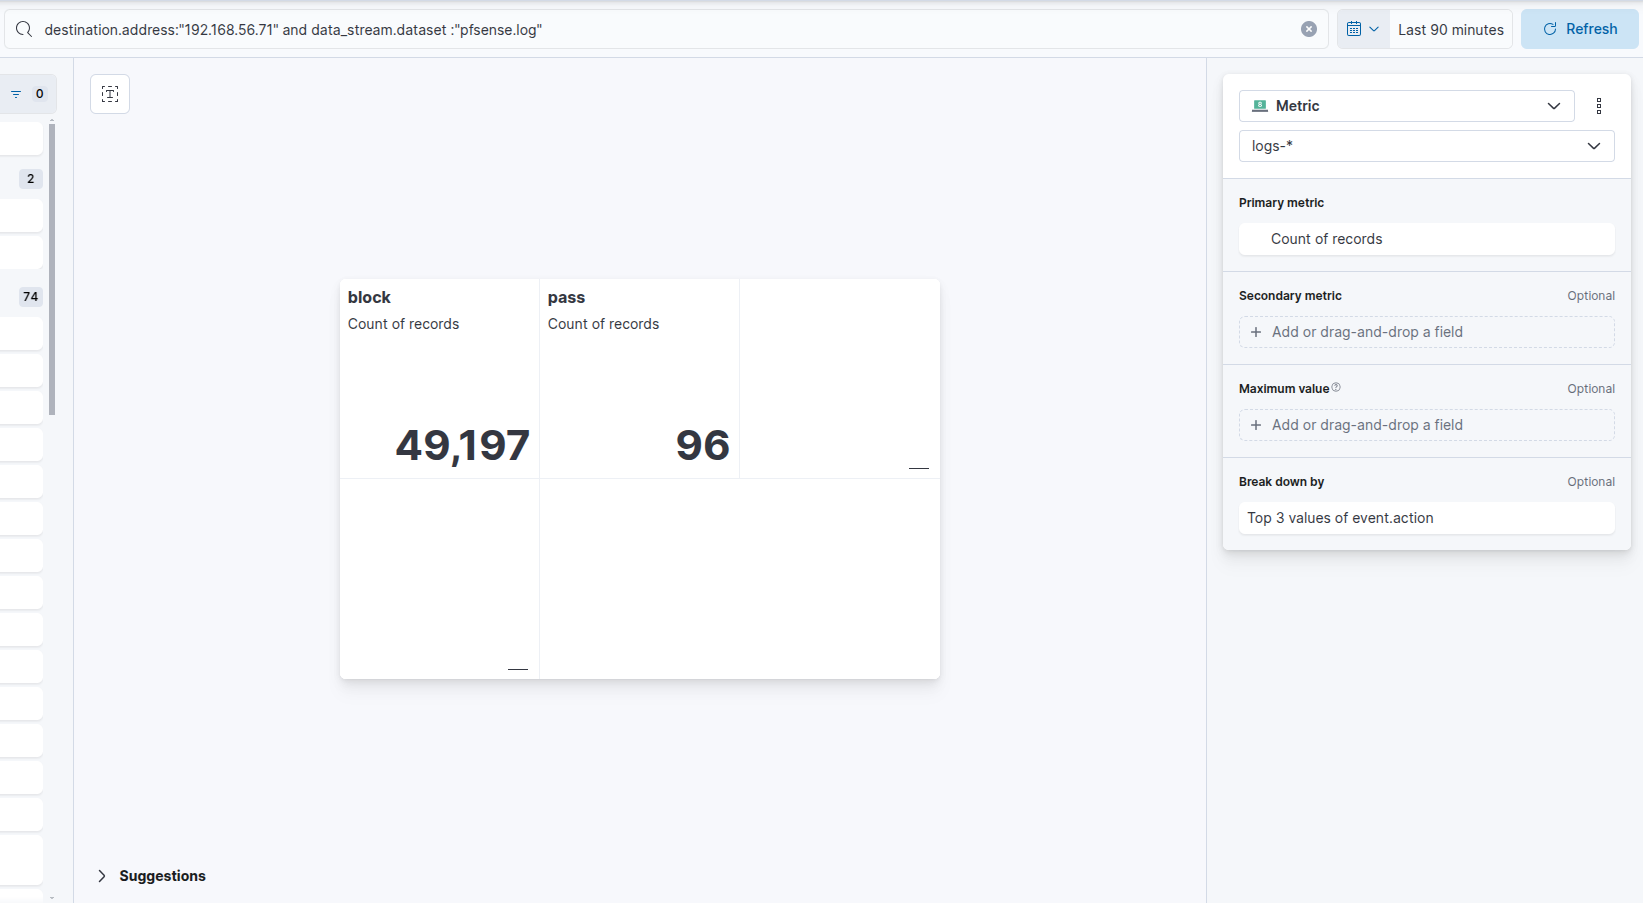 Kibana metric by event.action
So we can see there was ~50,000 blocked requests and ~100 successful requests.
Now go back to the ‘Discover’ tab:
Kibana discover tab
We’re going to do the same but in the new ES|QL query language. Click on ‘Try ES|QL’ near the refresh button:
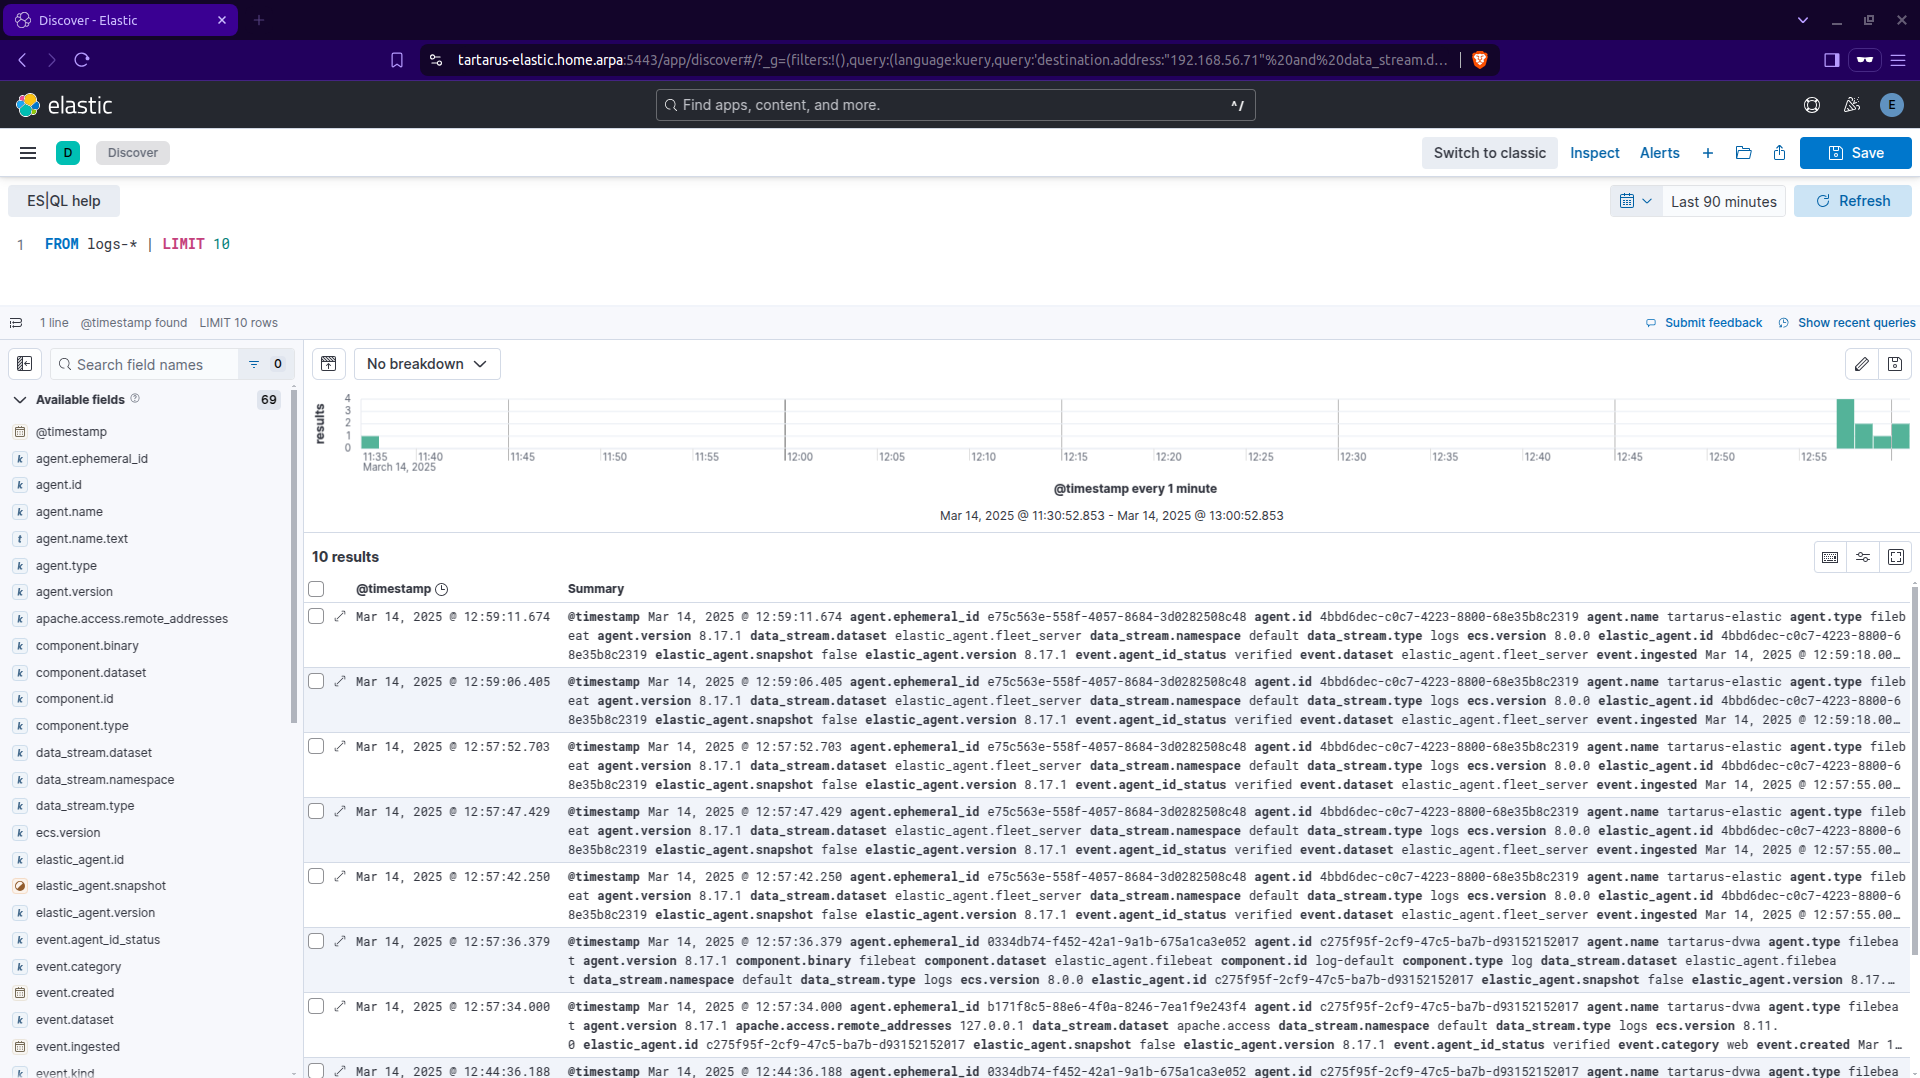 Kibana es ql search page
Search for the following:
1
2
FROM logs-* METADATA _id | WHERE event.dataset == "pfsense.log" AND event.provider == "filterlog"
| STATS COUNT_DISTINCT(_id) BY event.action
 Kibana es ql filter search
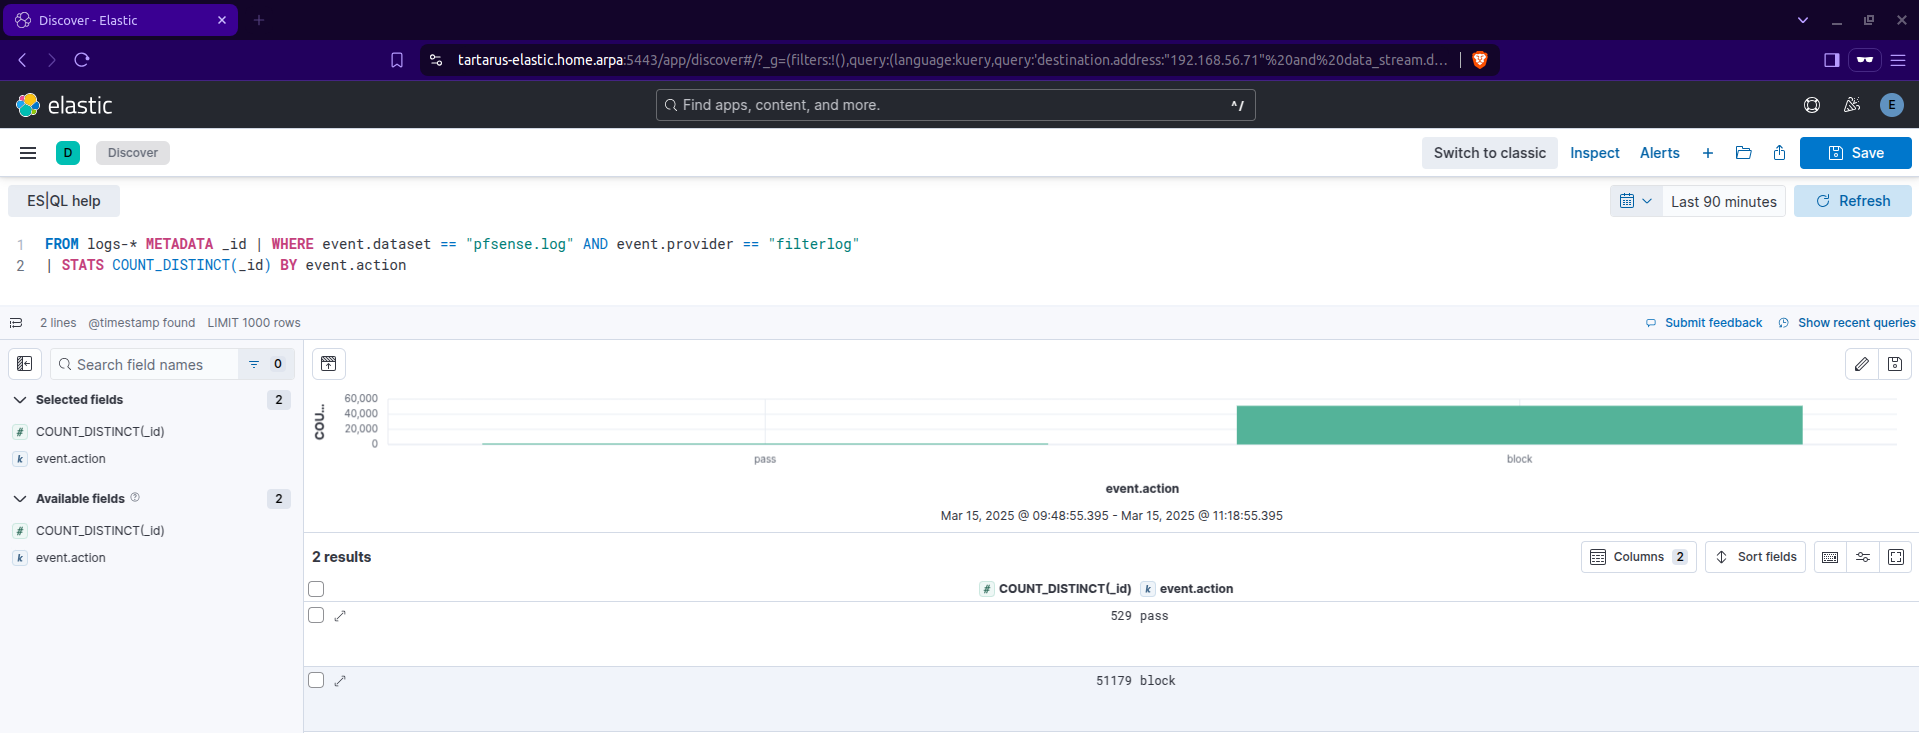
Now we can alter this a bit to create an alert.
1
2
3
4
5
6
FROM logs-* | WHERE event.dataset == "pfsense.log" AND event.provider == "filterlog"
| WHERE CIDR_MATCH(destination.ip, "10.0.0.0/8", "172.16.0.0/12", "192.168.0.0/16")
| WHERE event.action == "block"
| WHERE @timestamp > NOW() - 5 minutes
| STATS attempt_count = COUNT_DISTINCT(destination.port) BY source.ip
| WHERE attempt_count > 1000
Something like this would capture what we want, to break it down we are looking for a single source IP address going to over 1000 unique ports of any device(s) within RFC 1918 address space over a 5 minute time window. I am aware in pord the WAN addresses wouldn’t be in 1918 address space. :)
 Kibana es ql filter search
I will demonstrate how to make this ES|QL search into a rule at the end of the recon section (and all sections from here on out will have rules at the end).
Nmap obfuscations will be covered in the Medium Sec post.
ffuf
ffuf is used to do active recon of a target, in the recon section the first uses of it was to enumerate for sub-directories like /DVWA/. We will cover HTTP response codes now.
Side Channel: How You GET Webpages
I use curl to demonstrate the inner workings of how the requests get formulated, in my opinion it has more readability compared to doing it in a browser. However in this case I will also demonstrate how a browser handles GET and POST requests.
RFC 2616 defines valid methods, GET and POST are most common, however there are others; PUT, DELETE, HEAD, etc. The GET method is how a browser (you) request a resource from a web page.
Basic Browser
Now to login via a browser.
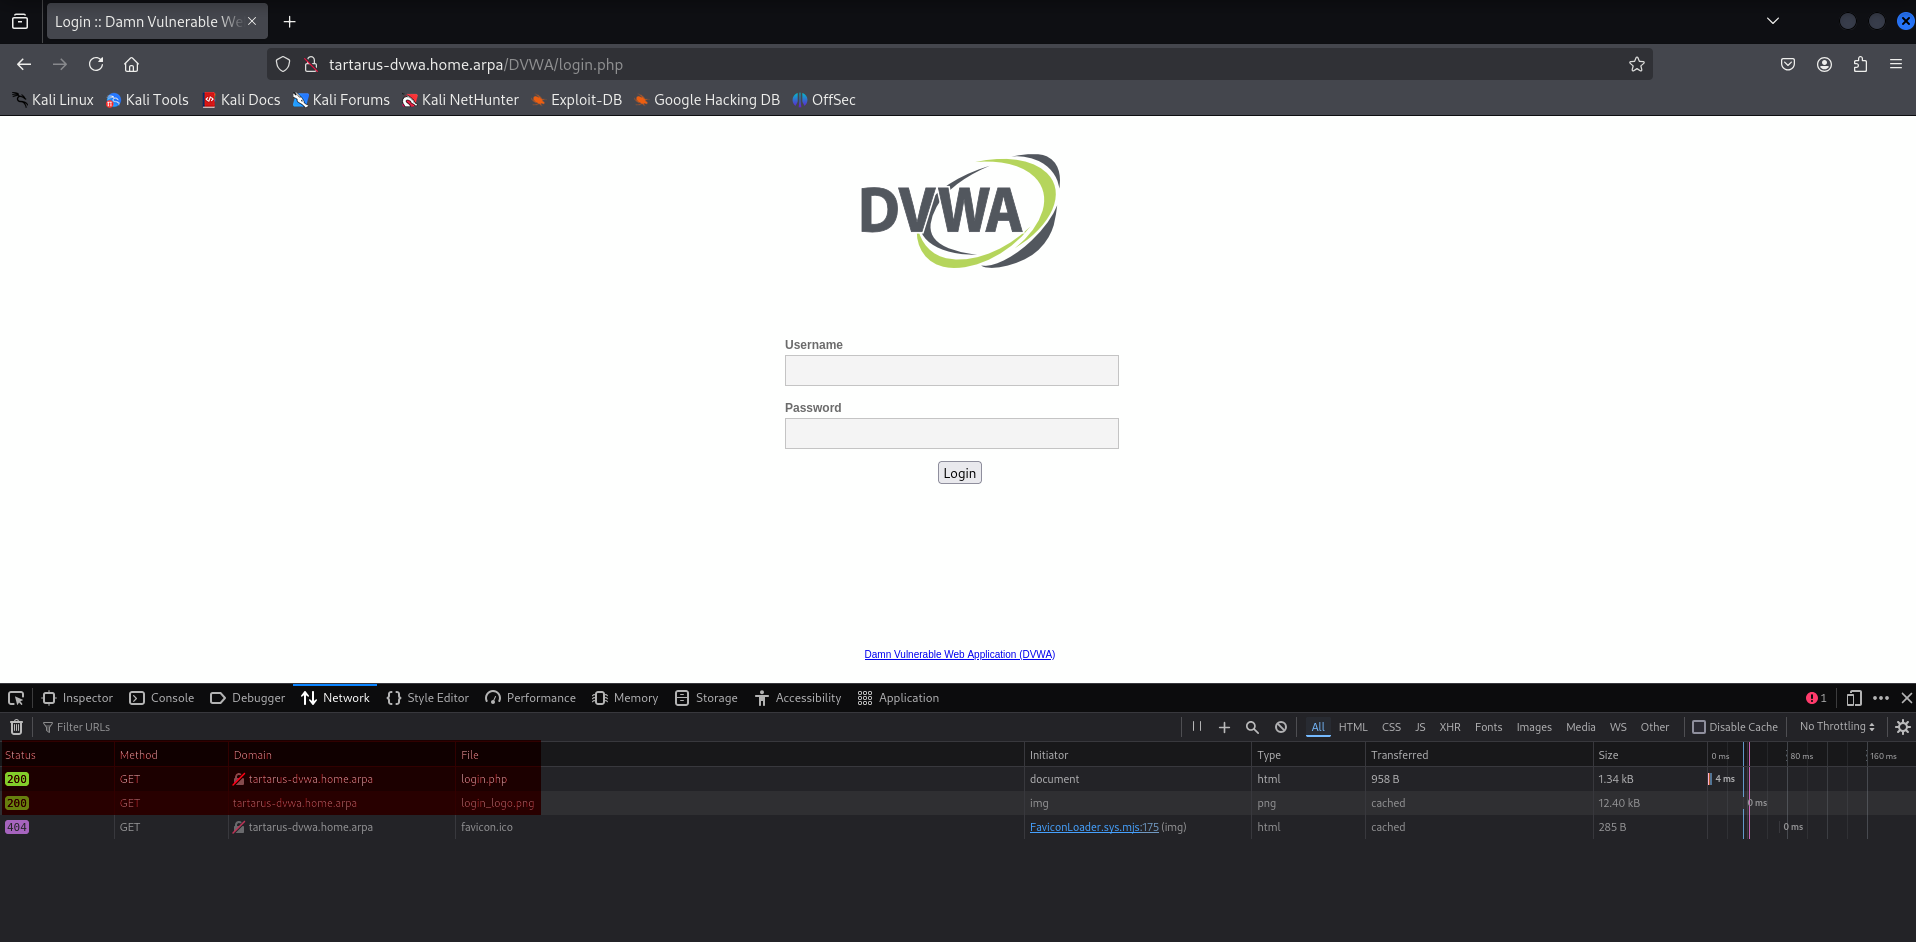 Main page login via browser
You can see the browser used the GET method to fetch the file login.php from the server, this returned a 200 response code, meaning it was successful.
Now to the login.
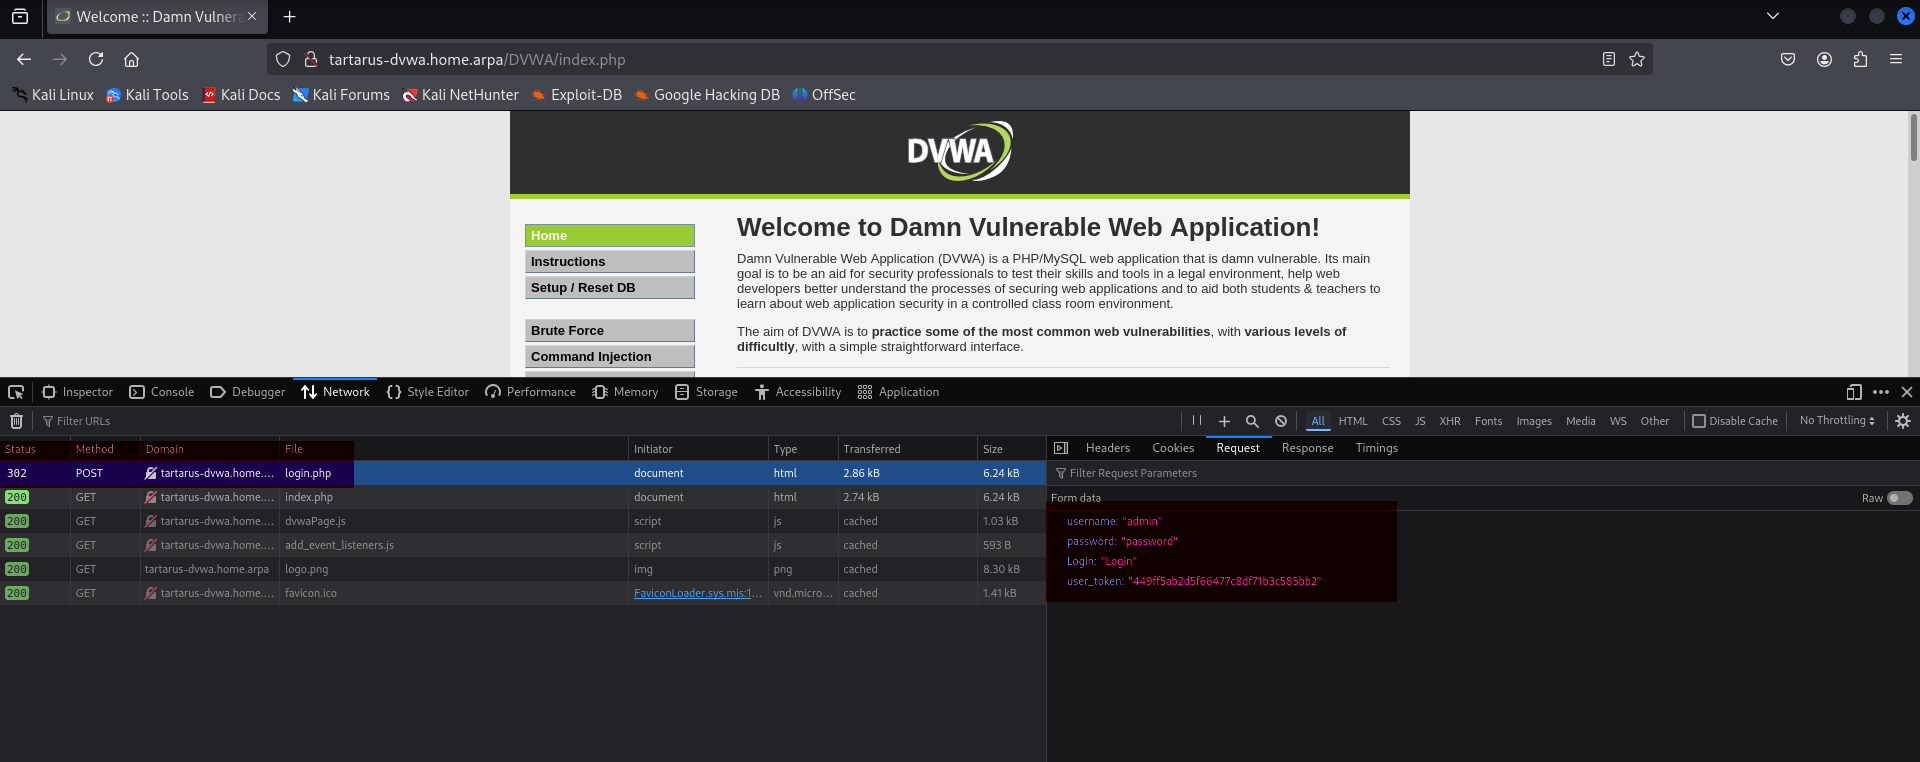 Main page login via post method
Entering data into the username and password field in the login page then sends that data via a POST request to the server as you can see above; the username, password, Login, and, user_token.
curl
Take this curl request as an example, how we load the web page:
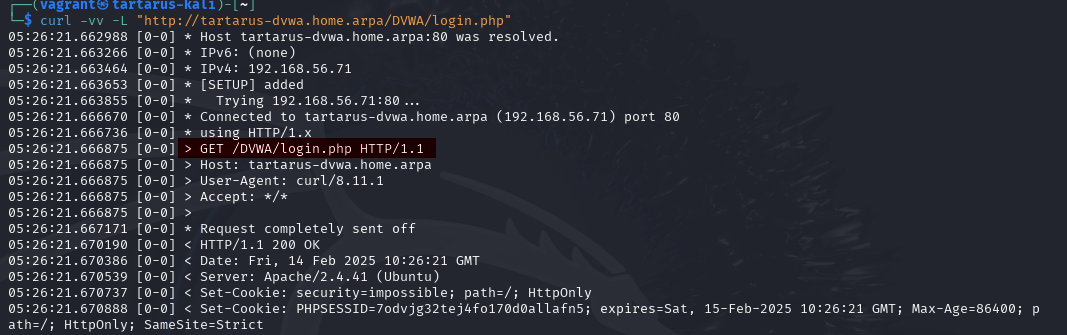 Curl get request example
The highlighted area GET /DVWA/login.php HTTP/1.1 is telling the server what resource to get. You can try GET anything from the server, and depending on the response code we know if it was successful (200) or failed (like 404 or 501).
Now we know more about the GET method, the other method I would like to explain is POST. This is how we log into the main webpage, you can see below how it happens:
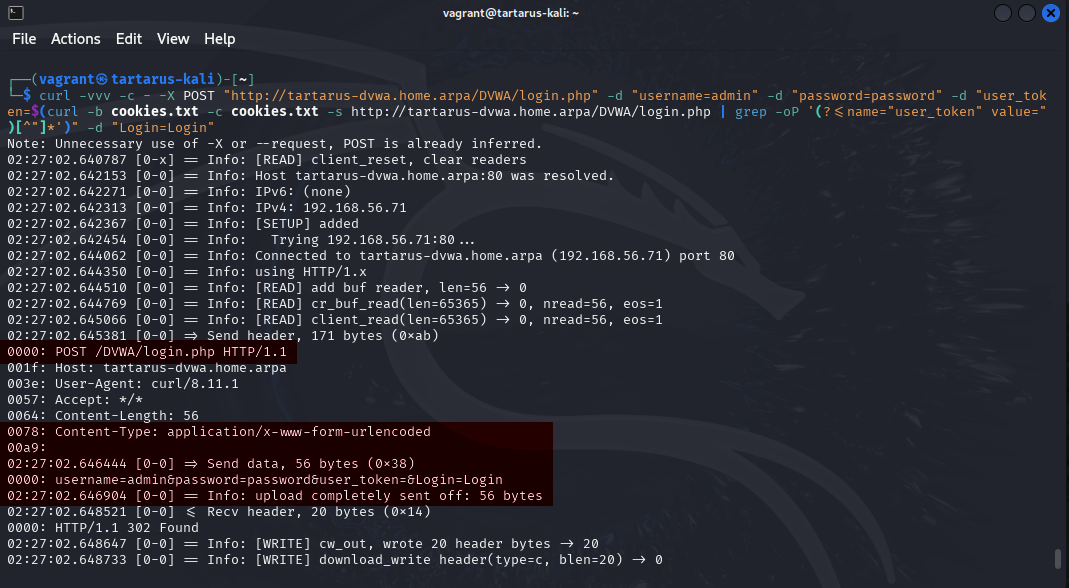 Curl post request login example
In the above example we can see 56 bytes were sent to the server:
1
username=admin&password=password&user_token=&Login=Login
We will cover a CSRF bypass with this knowledge in the Medium Sec Recon post.
Now that you have some exposure to HTTP Methods and response codes lets try make a rule to detect the directory enumeration attempt.
Elastic Recon Rule Creation - Preamble
Lets simulate a recon attempt for sub-directories of /DVWA/.
In the Kali guest open a terminal and run the following:
You’ll need
seclistsinstalled.sudo apt install seclists
1
ffuf -w /usr/share/wordlists/seclists/Discovery/Web-Content/common.txt -u http://tartarus-dvwa.home.arpa:80/DVWA/FUZZ -mc 200 -r
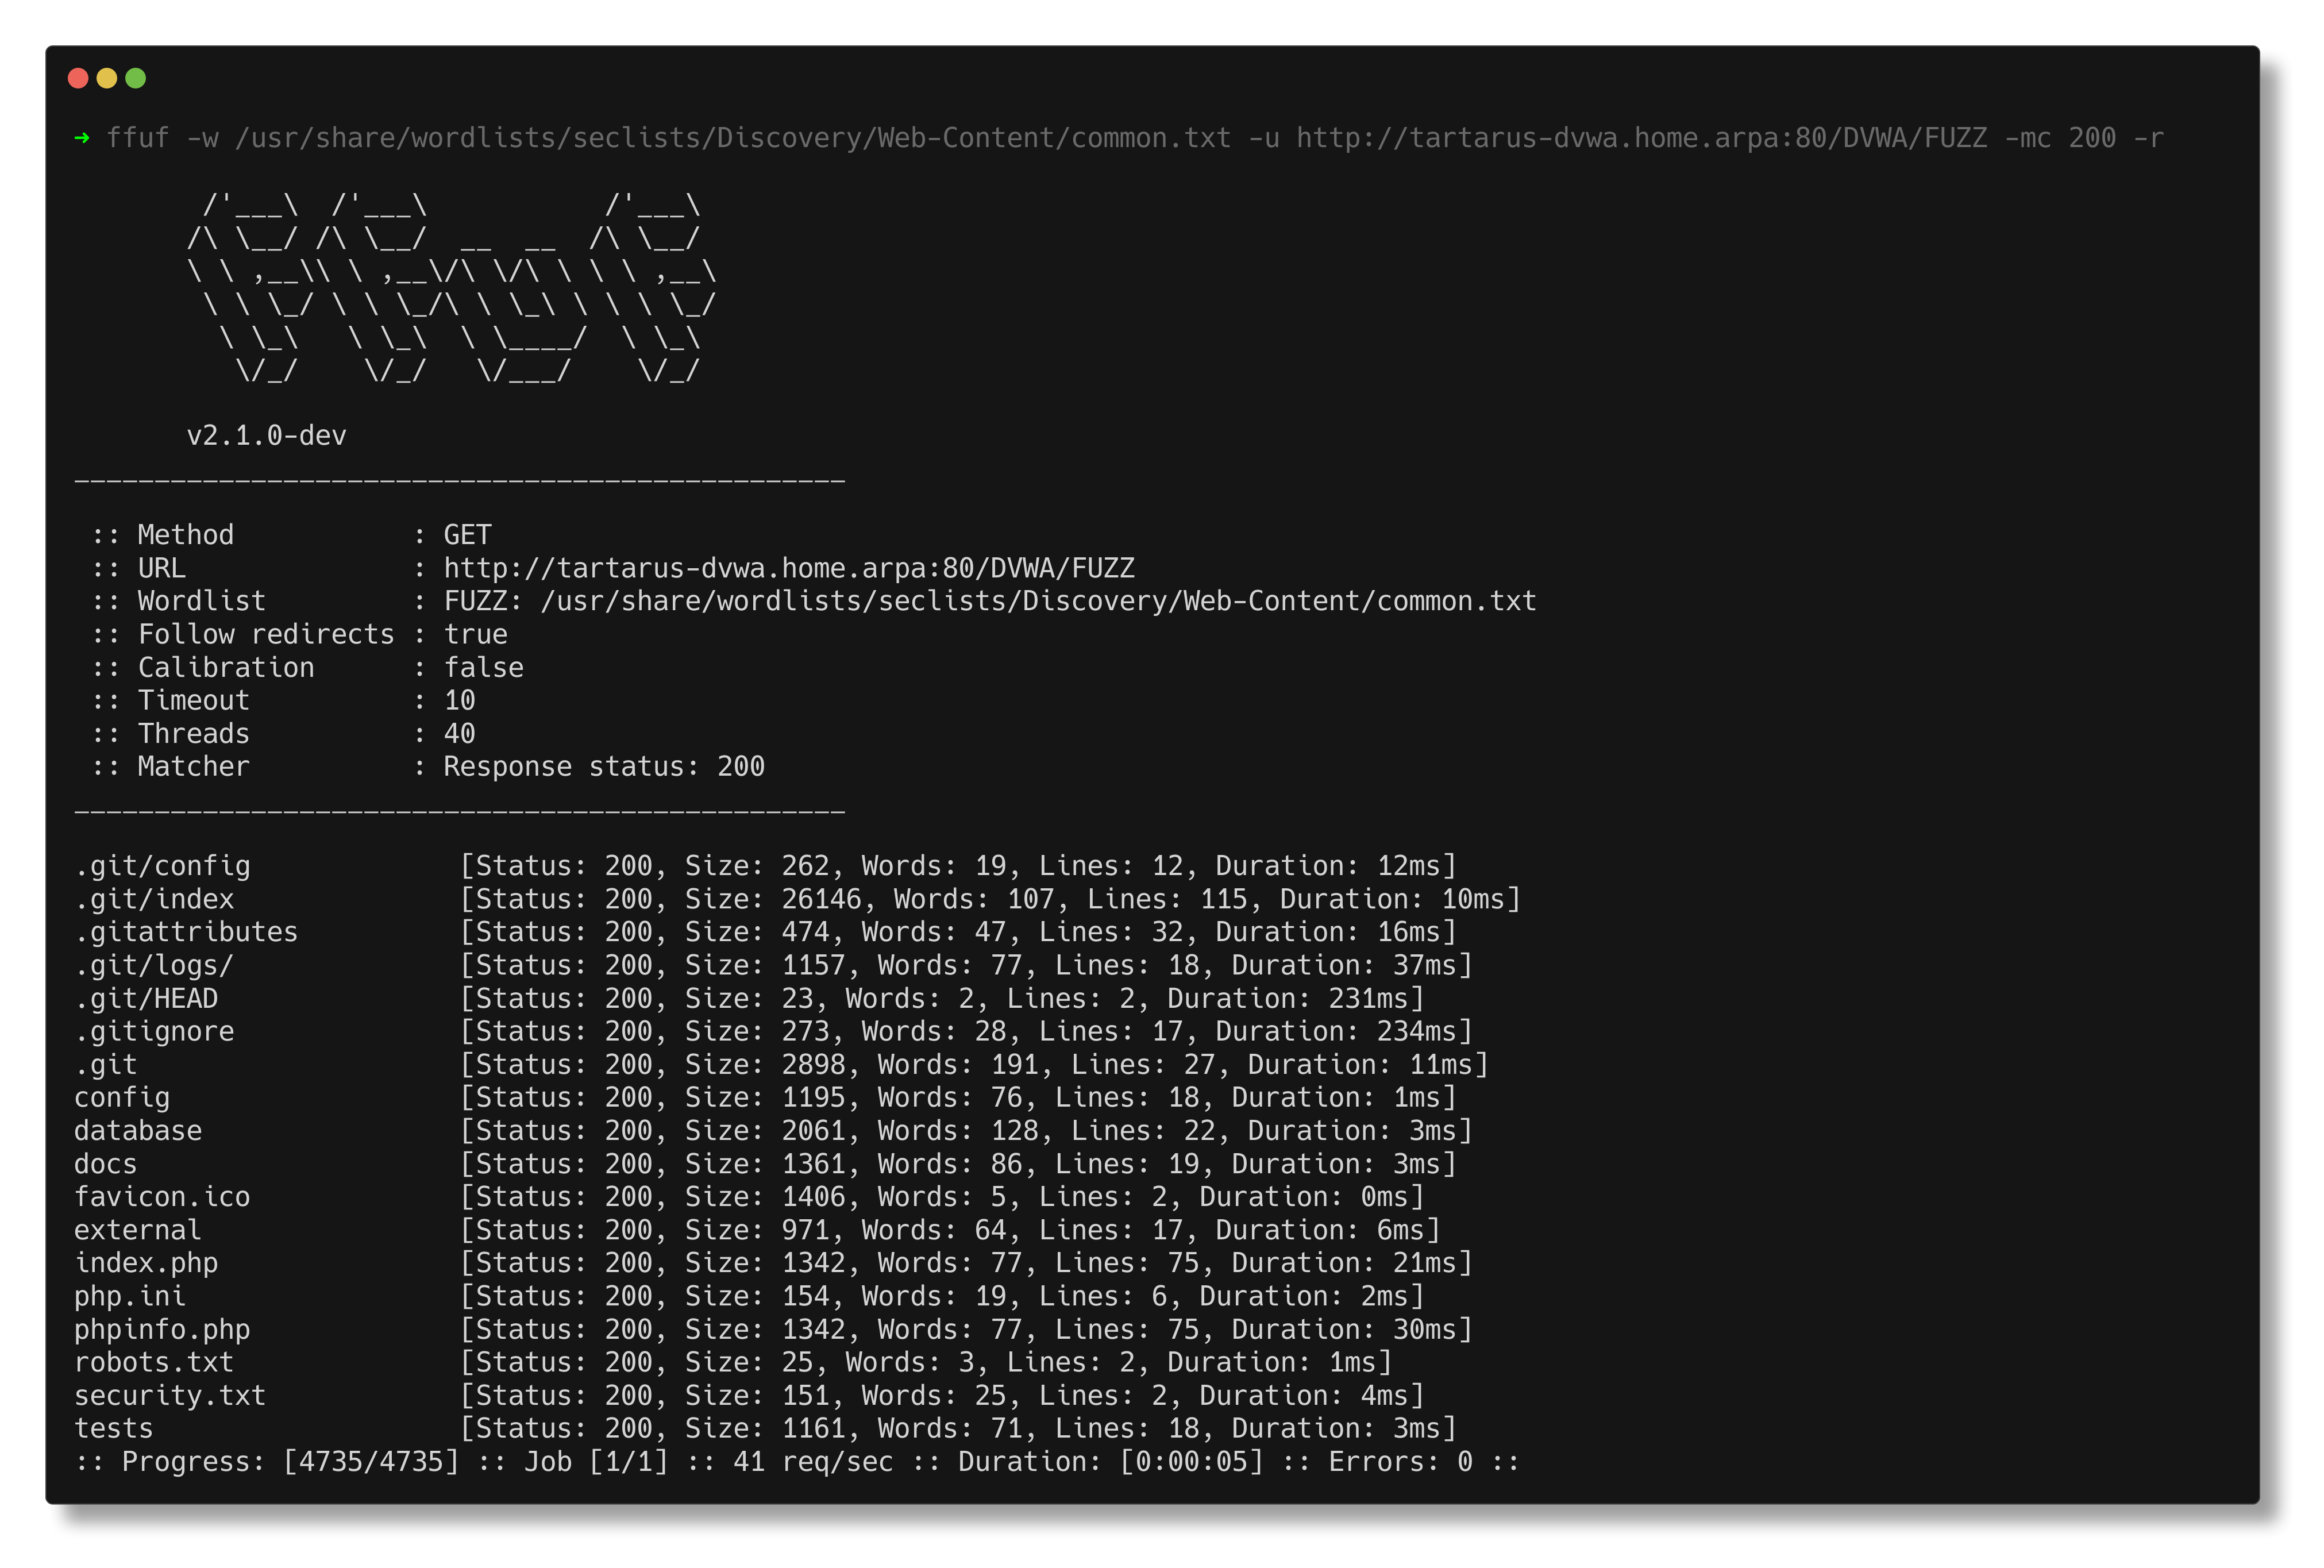 Ffuf recon scan
In the Kibana browser go to the Discover tab to view what’s happened. https://tartarus-elastic.home.arpa:5443/app/discover#/
You should see something like (if not adjust the time window, next to the refresh button):
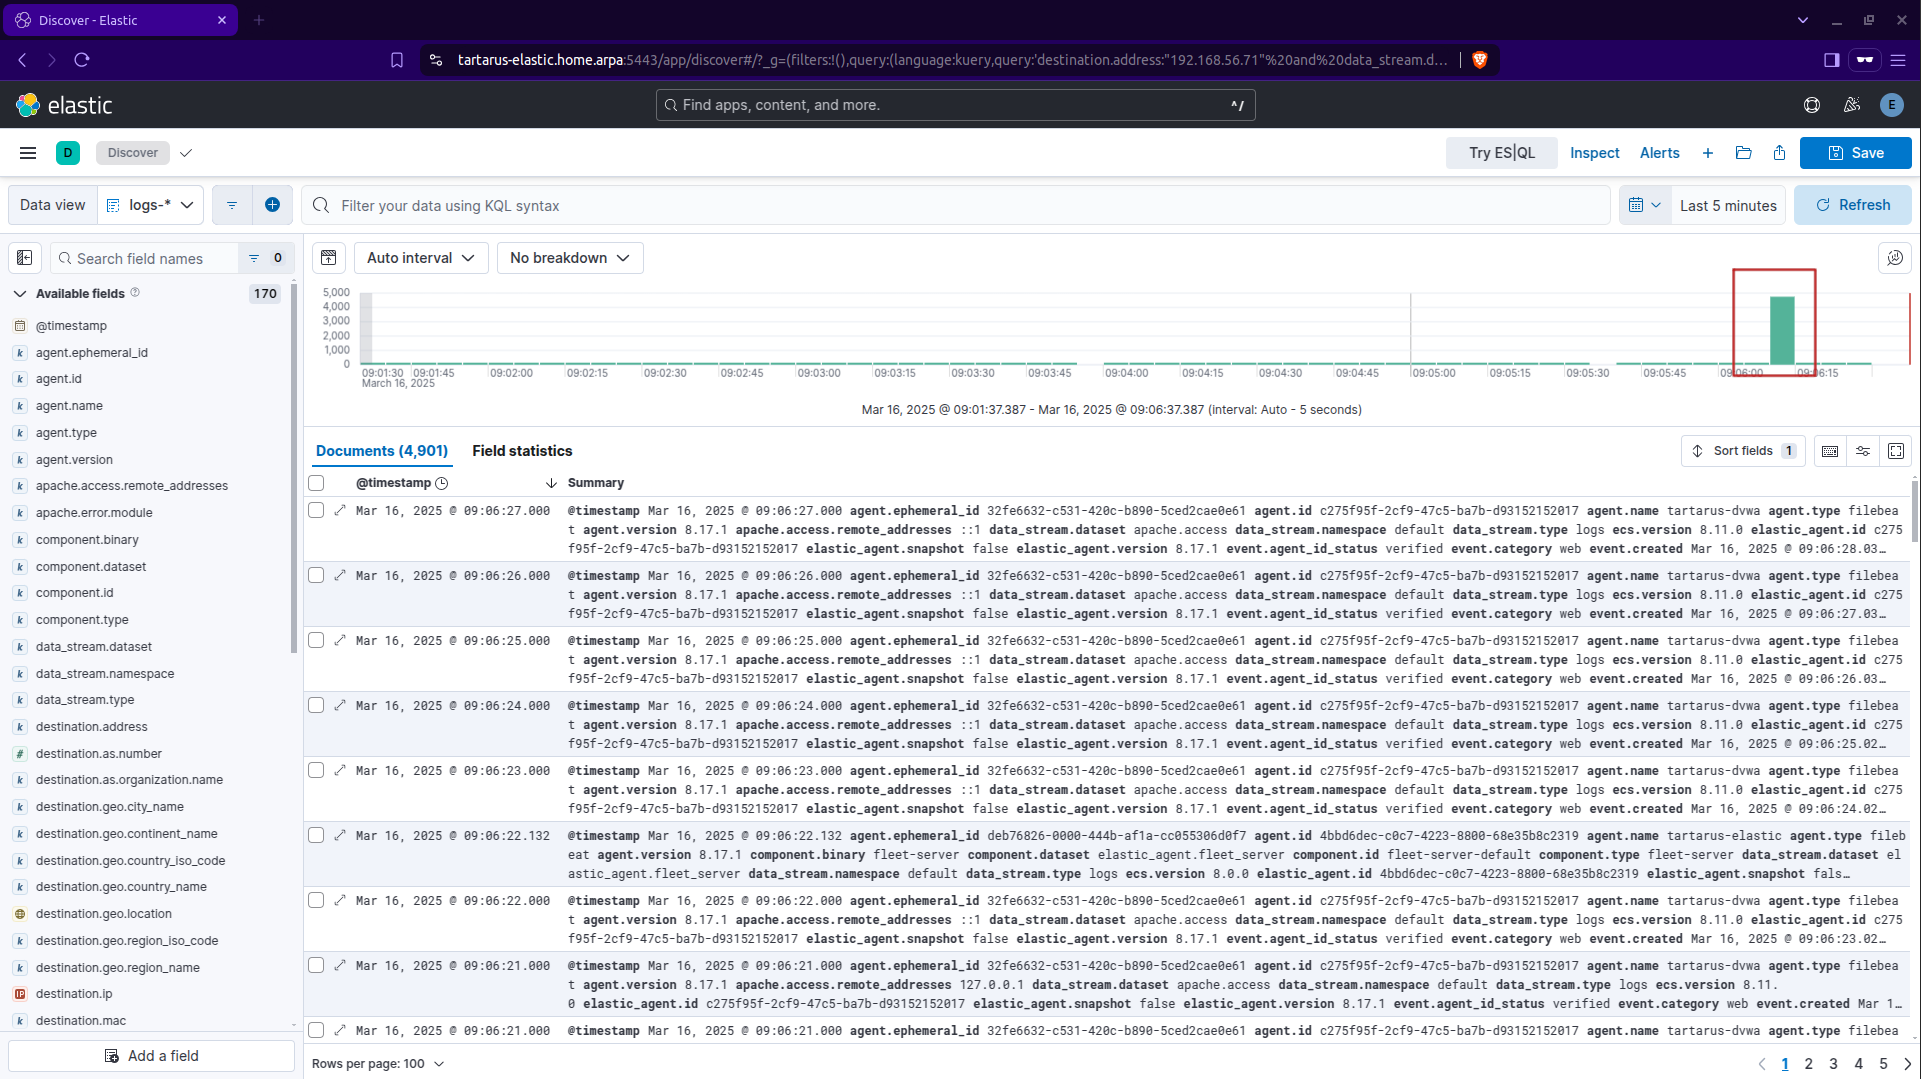 Kibana ffuf scan results
As you can see an increase of ~5,000 logs in that bucket. If you wanted to you can highlight the tower in the histogram and only view those event or you can rightclick on it.
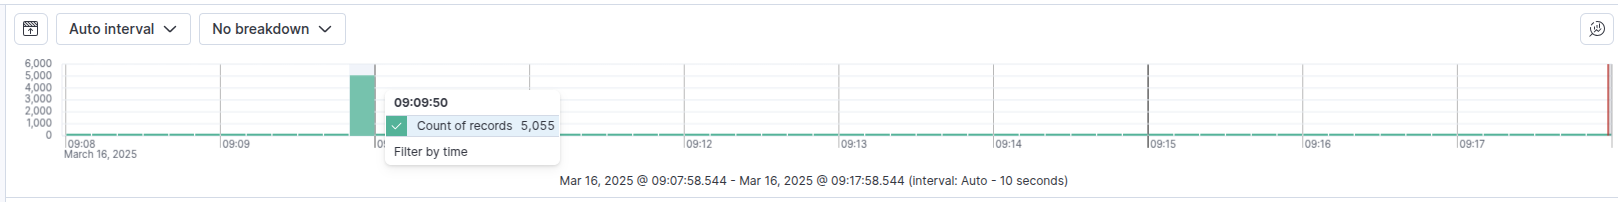 Kibana time filter
Drill down on the time window until the only thing in the histogram is the large tower.
Expanding one of the events we get something like:
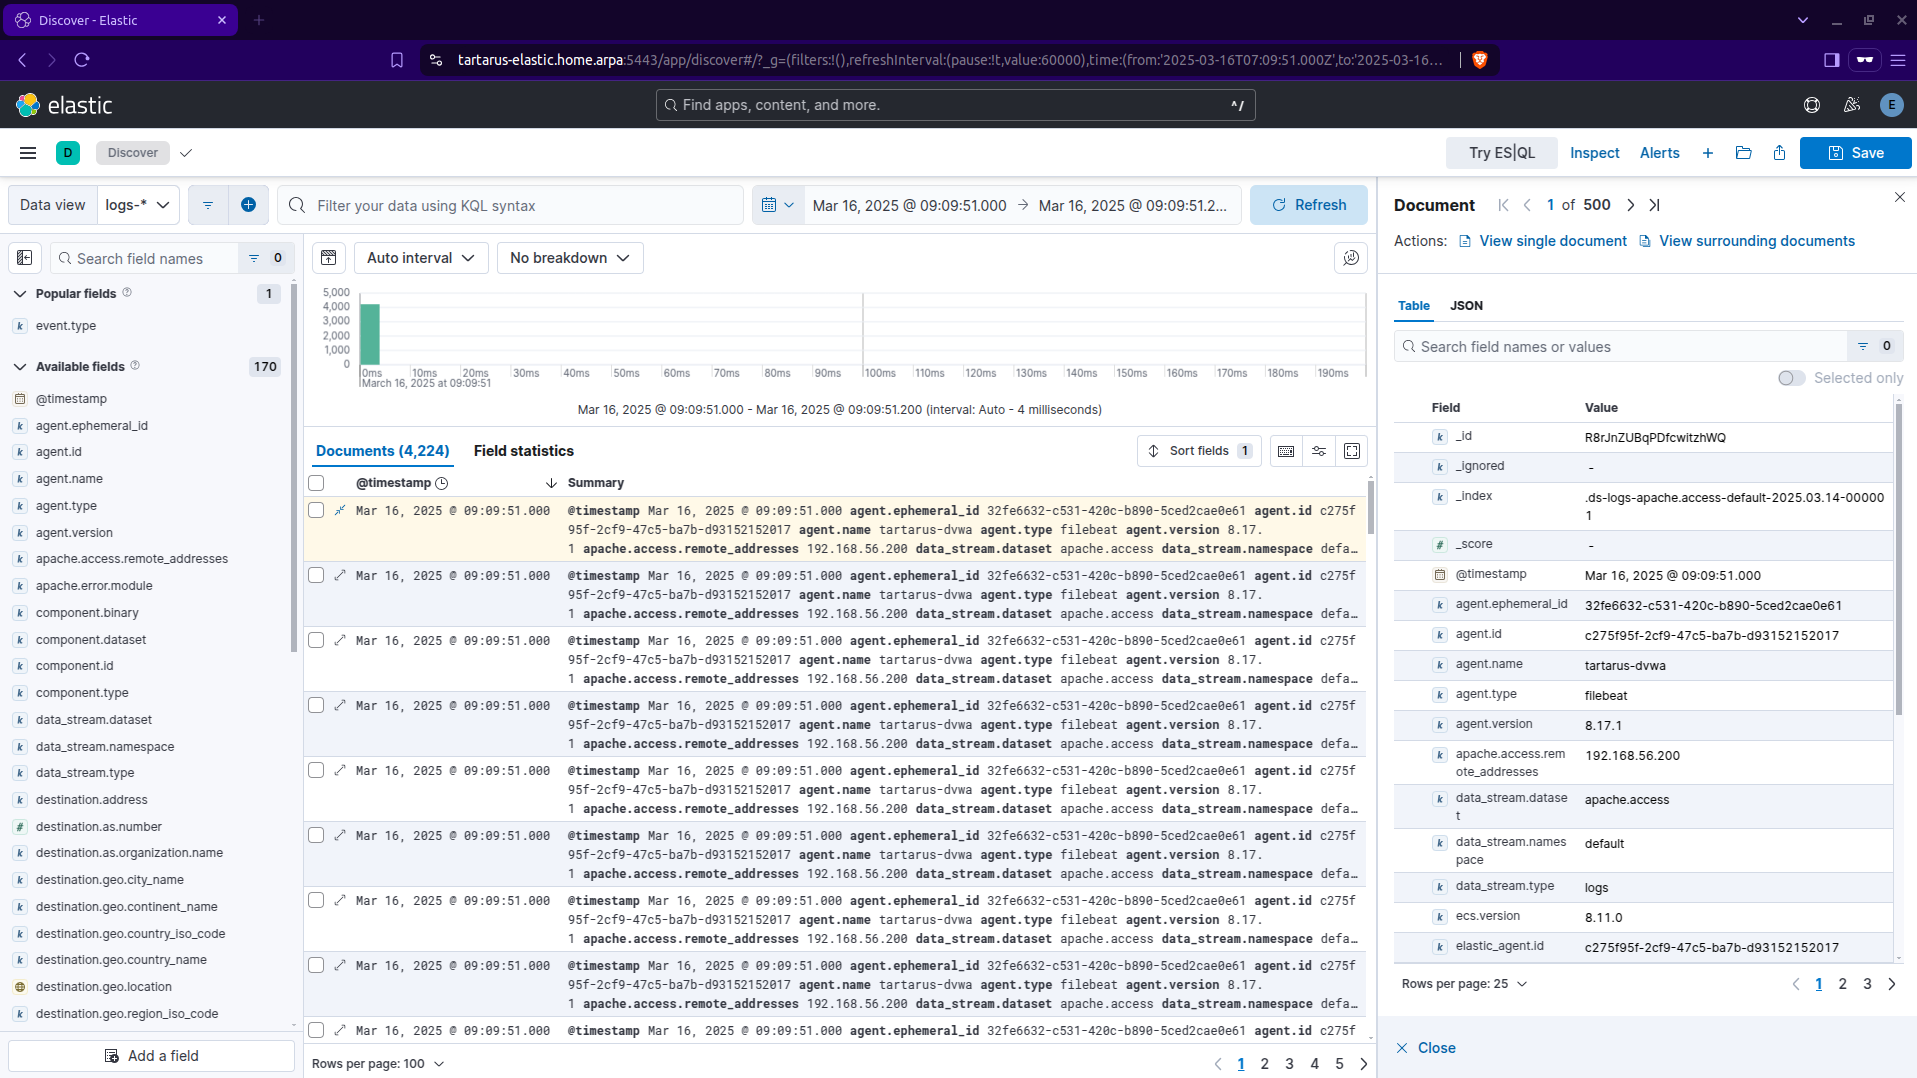 Kibana ffuf scan expand
Now we can have a dig into what fields are recorded, the primary fields we are interested in are; http.request.method, http.response.status_code, source.ip, url.path and user_agent.original.
This is just to demonstrate them in a document:
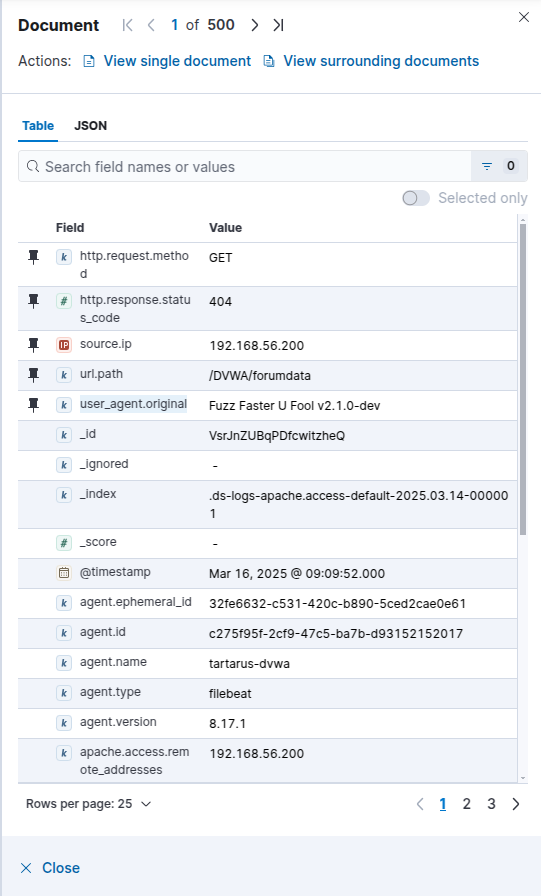 Kibana document view
When creating a new alert you must understand the source data - in detail.
We have a few avenues to create detection logic, the most simple is look at that User-Agent, Fuzz Faster U Fool seems like quite the unique value. You can search for all logs with a User-Agent like this with:
1
user_agent.original : *Fuzz Faster U Fool*
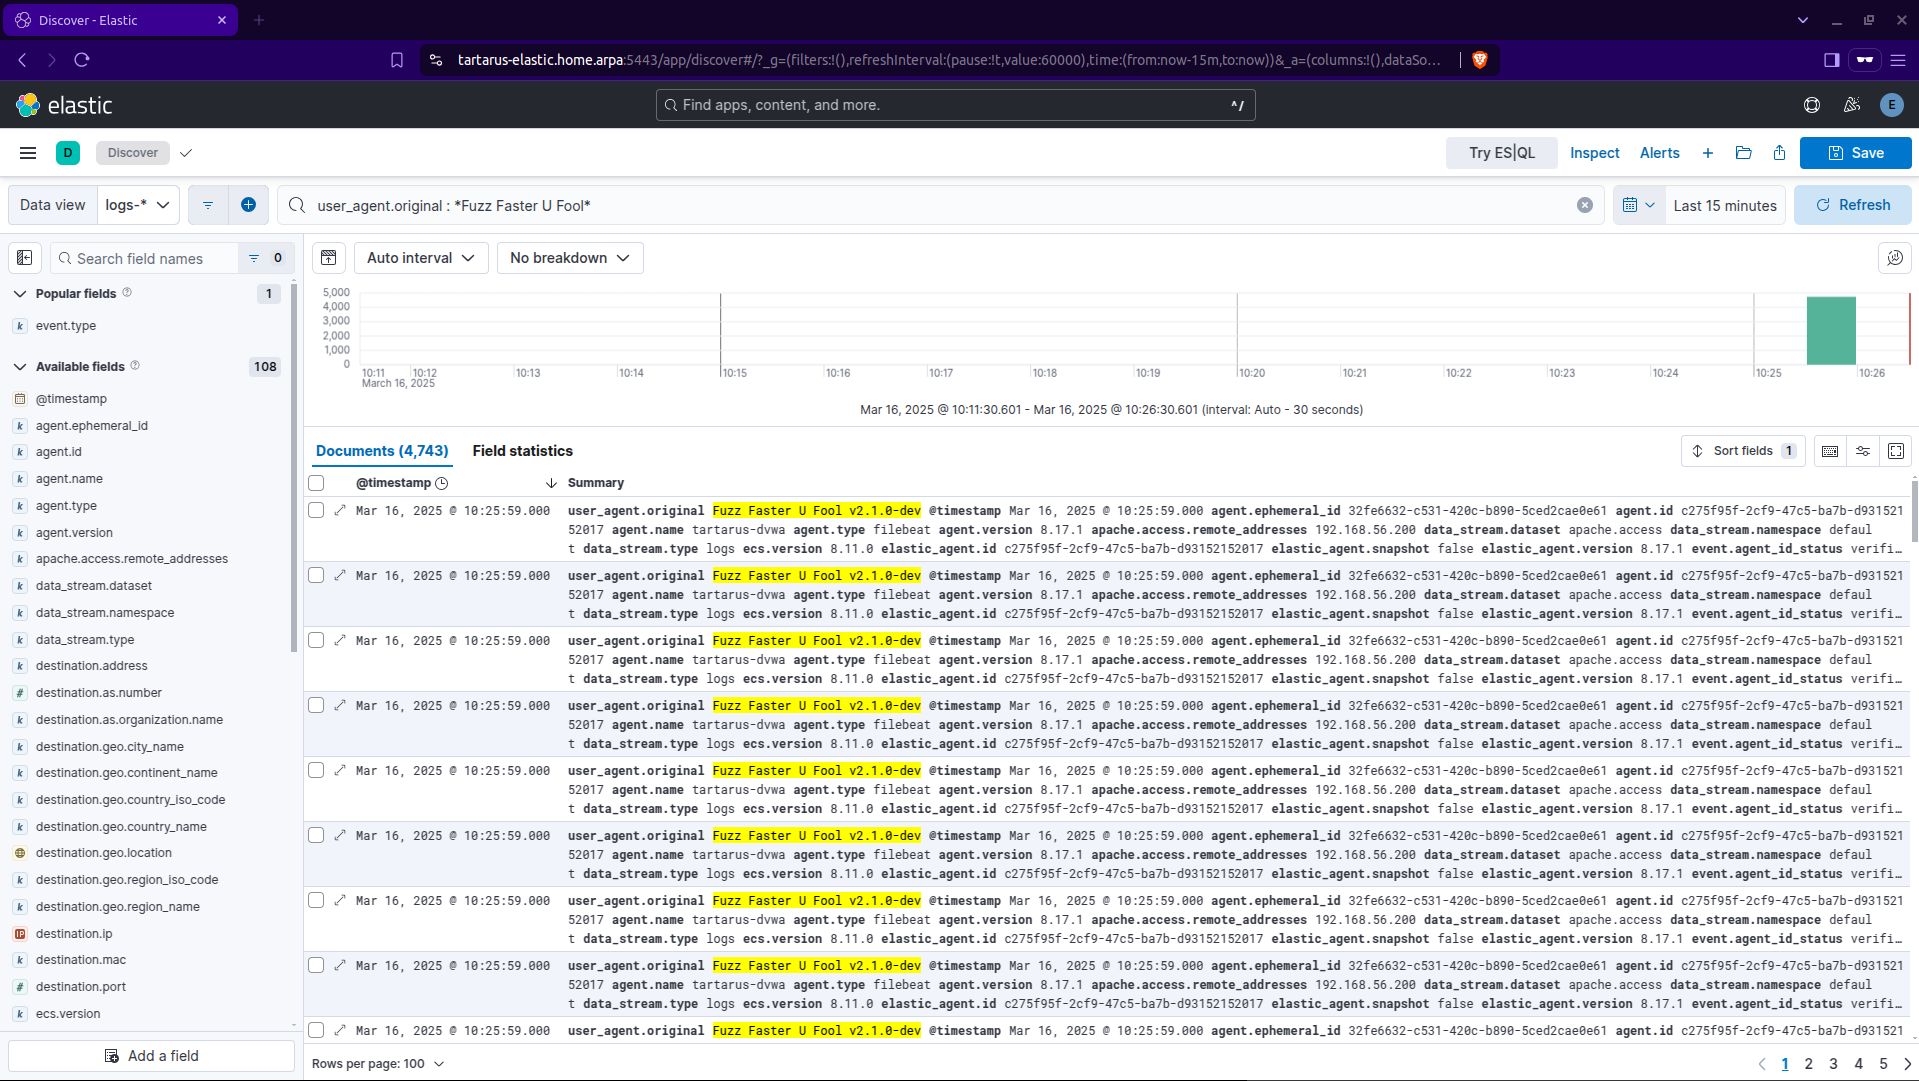 Kibana kql search for user agent
You can do the same thing for the
nmapUser-Agent if you ran thenmapscan with the-Aflag.user_agent.original : *nmap*
Easy peasy just write a rule to detect all these suspicious User-Agents and we can call it a day…
Not quite! What about:
1
ffuf -H "User-Agent: Mozilla/5.0 (Windows NT 10.0; Win64; x64) AppleWebKit/537.36 (KHTML, like Gecko) Chrome/132.0.0.0 Safari/537.3" -w /usr/share/wordlists/seclists/Discovery/Web-Content/common.txt -u http://tartarus-dvwa.home.arpa:80/DVWA/FUZZ -mc 200 -r
Our detection logic is in shambles…
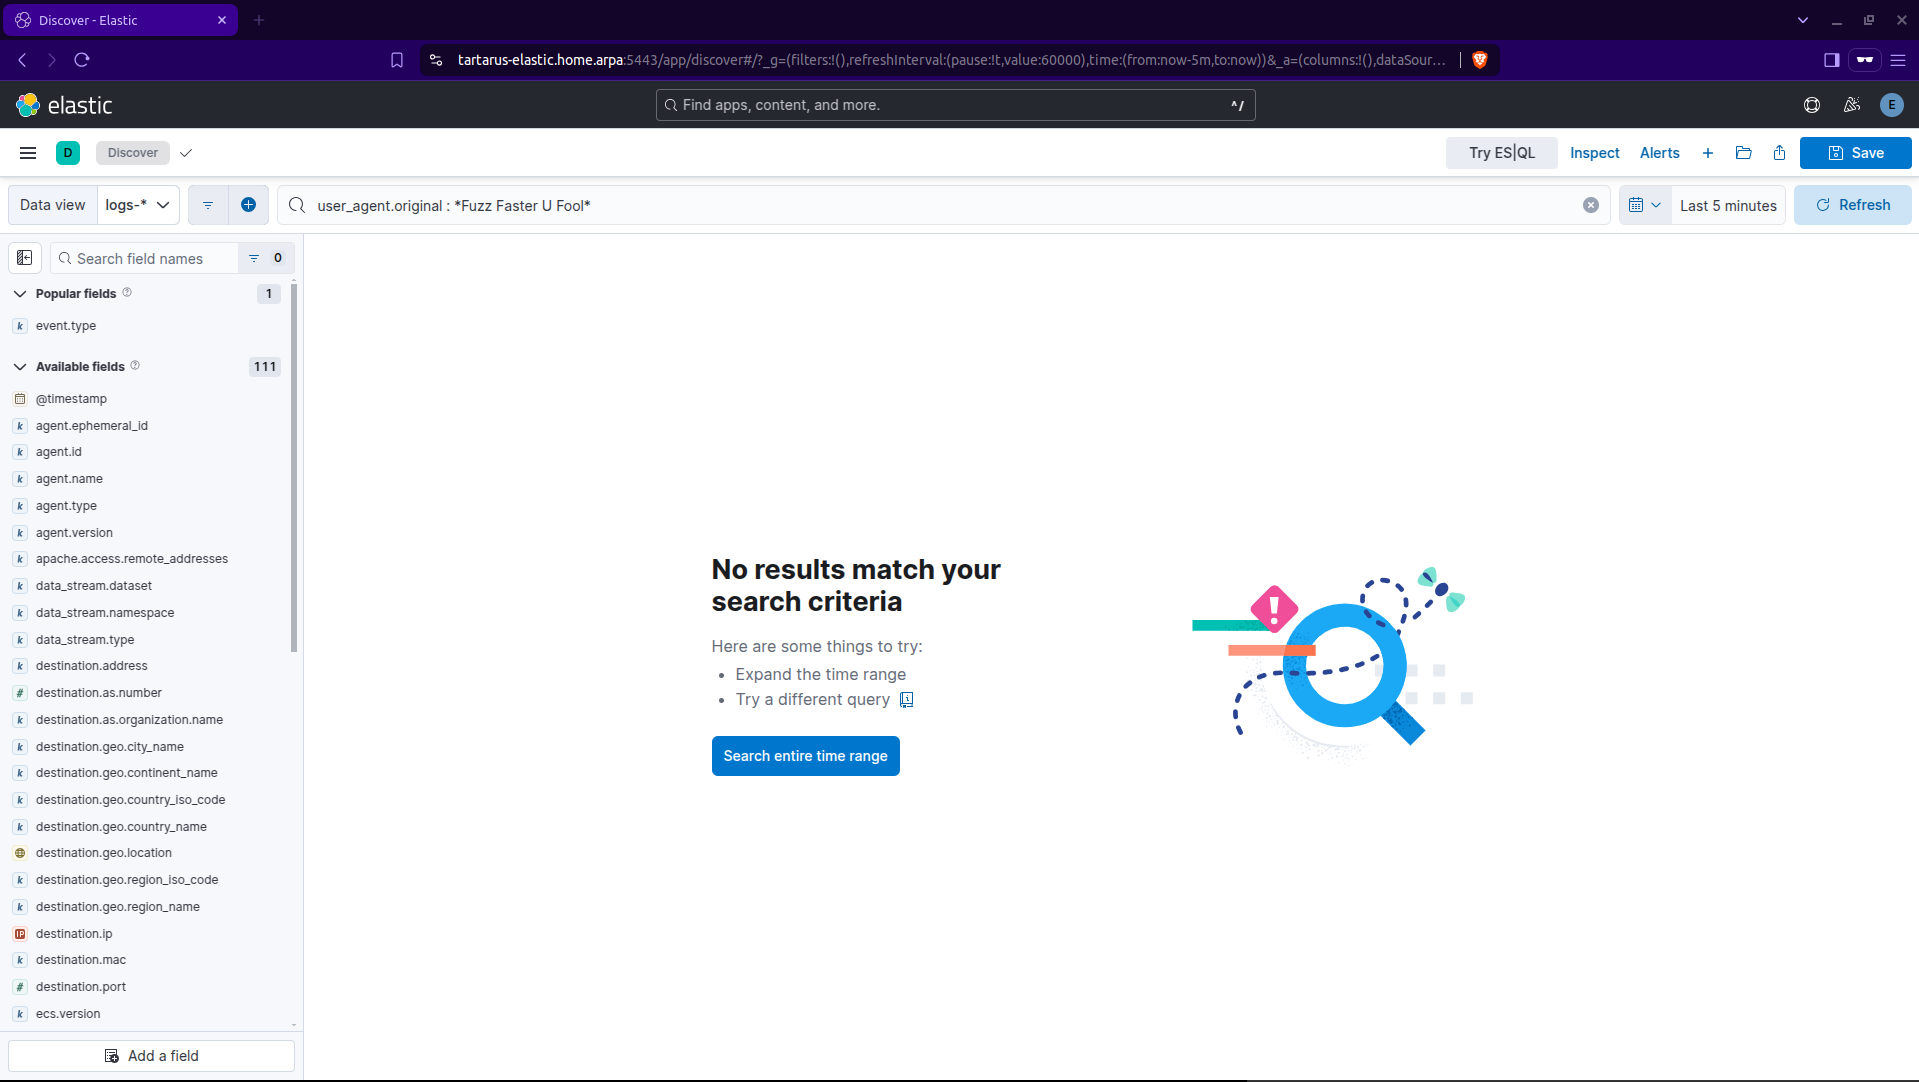 Kibana kql search for user agent missing
So we could catch Skiddies and Bug-Bounty Boiz, but our main man TA (Treat Actor) will sail by. What are we to do about it? Lets take a closer look at the activity, they are trying to enumerate all the directories under /DVWA/ since we aren’t serving all the directories in their wordlist there will be a disparity in response codes returned. They will get some 200 OKs, the majority will be 404 so we can then use this as a signal.
Moving to the ES|QL search page do a little:
1
2
3
4
5
6
FROM logs-*
| WHERE event.dataset == "apache.access" AND event.category == "web"
| WHERE url.path != "/server-status"
| WHERE http.request.method == "GET" AND http.response.status_code == 404
| WHERE @timestamp > NOW() - 5 minutes
| STATS COUNT(url.path) BY user_agent.original, source.ip
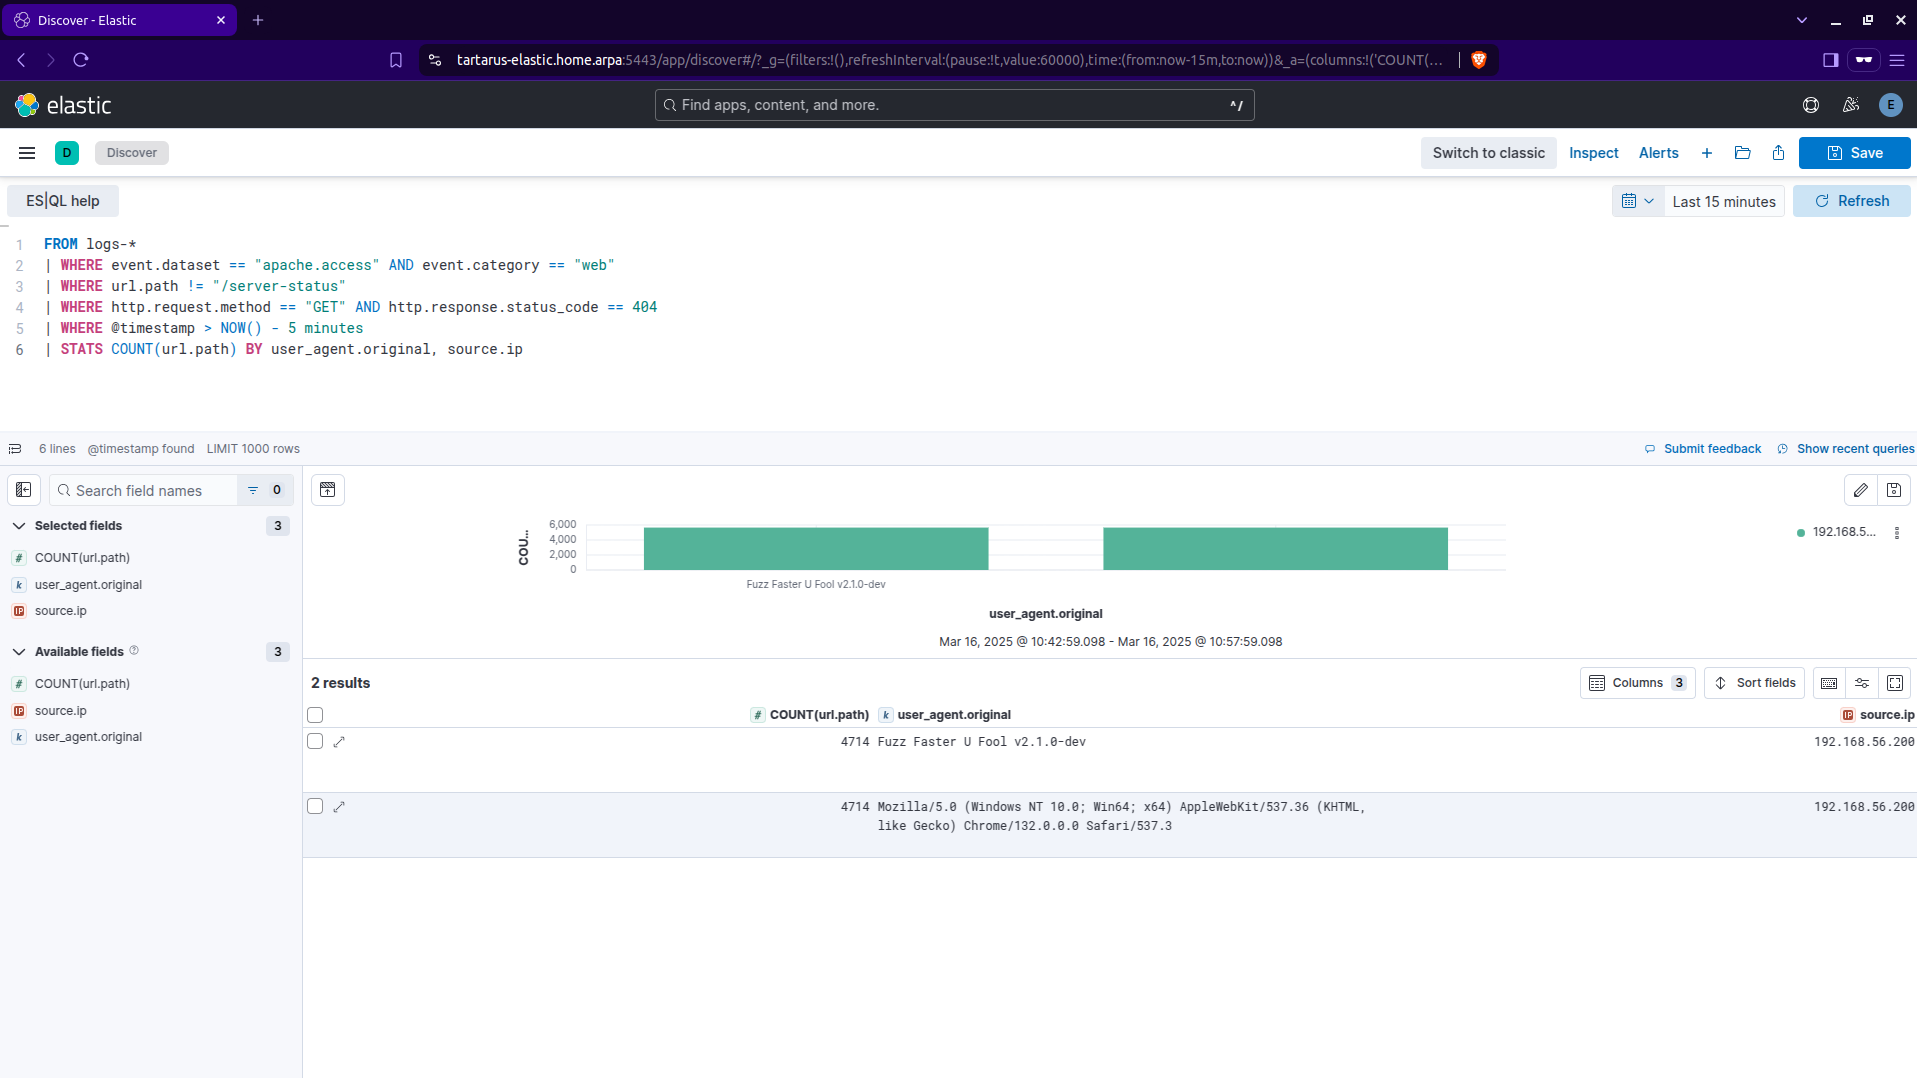 Kibana es ql search for user agent
Small modifications and it’ll be more rule ready:
1
2
3
4
5
6
7
8
FROM logs-*
| WHERE event.dataset == "apache.access" AND event.category == "web"
| WHERE url.path != "/server-status"
| WHERE http.request.method == "GET" AND http.response.status_code == 404
| WHERE @timestamp > NOW() - 5 minutes
| STATS attempt_count = COUNT(url.path) BY source.ip
| SORT attempt_count DESC
| WHERE attempt_count > 1000
This search selects Apache access logs that use the GET method and get a 404 over the last 5 minutes where there are more than 1000 requests by a single source IP address.
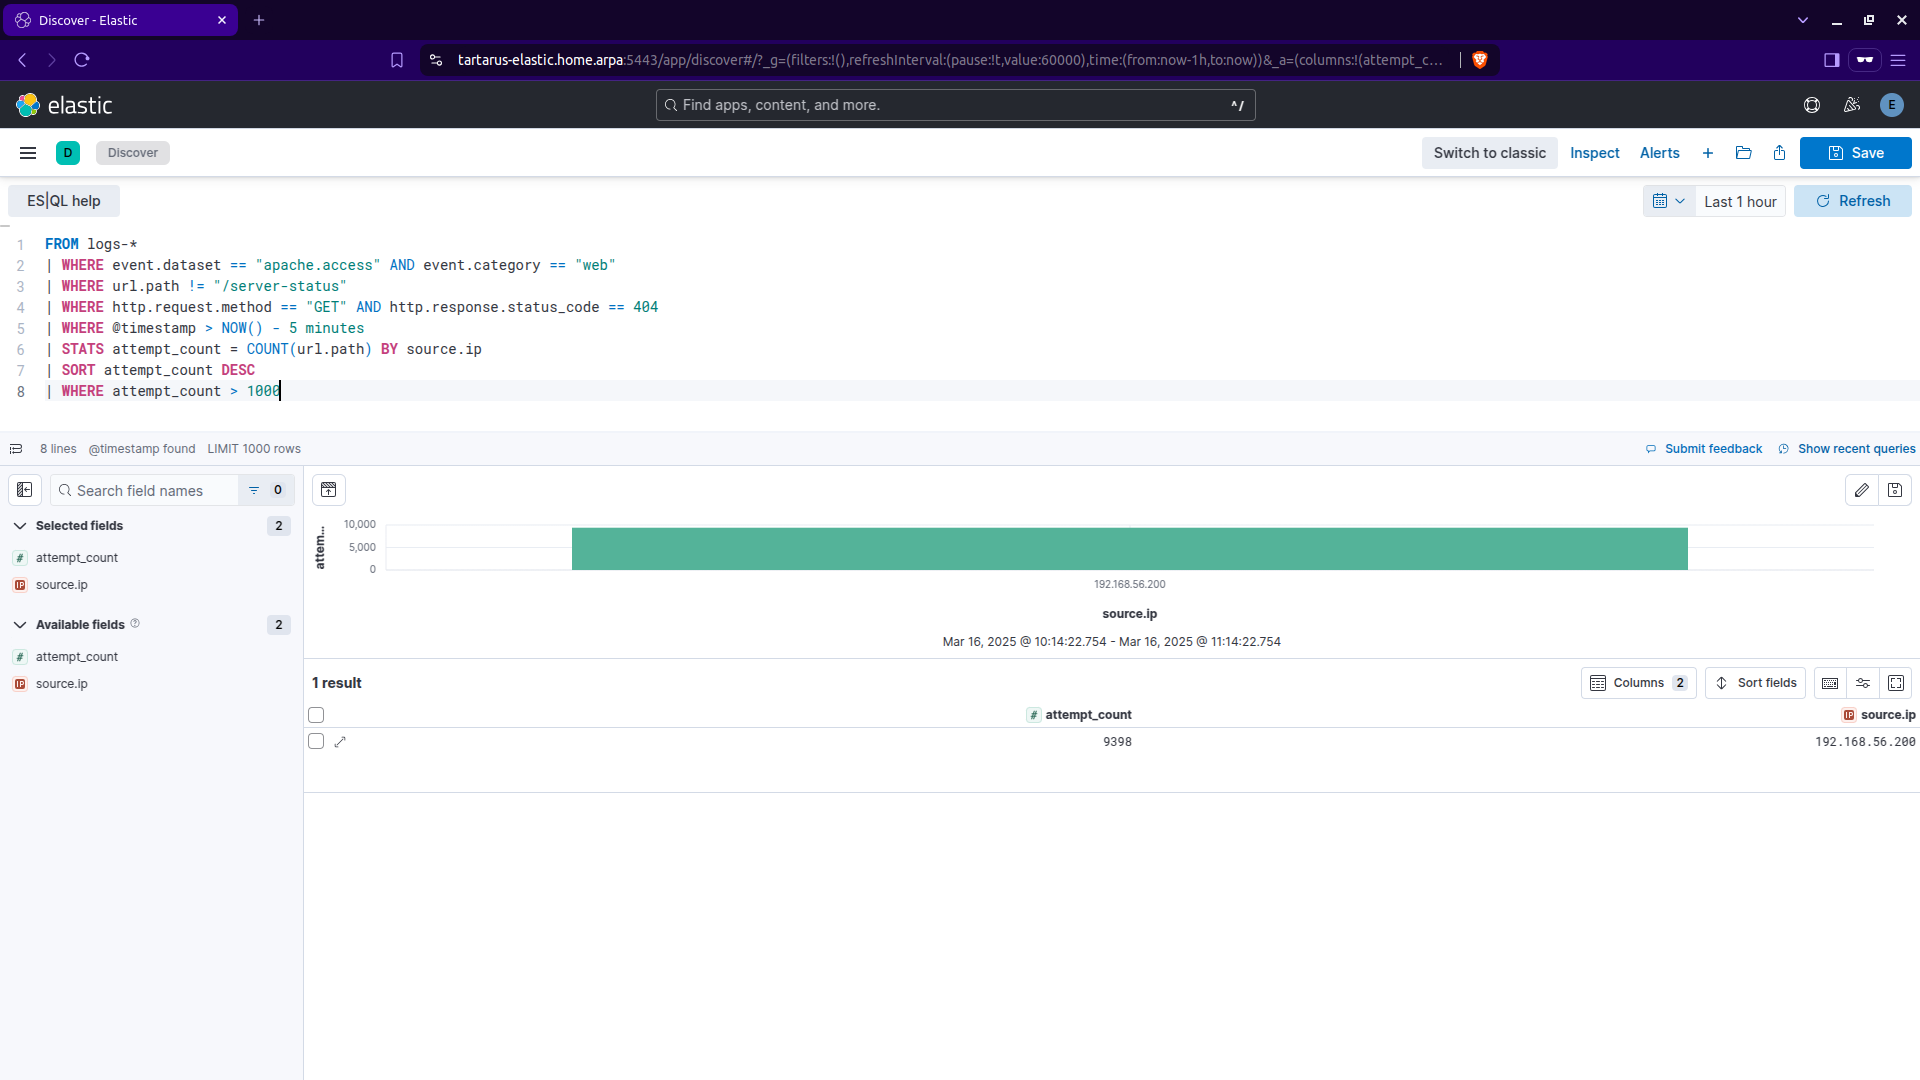 Kibana es ql search for dir enum
Elastic Recon Rule Creation - Manual
Now that we have effective ES|QL searches lets transition to creating detection rules. I will demonstrate how to create a demo rule from scratch, after that all rules will be imported for you.
Navigate to the “Security” section:
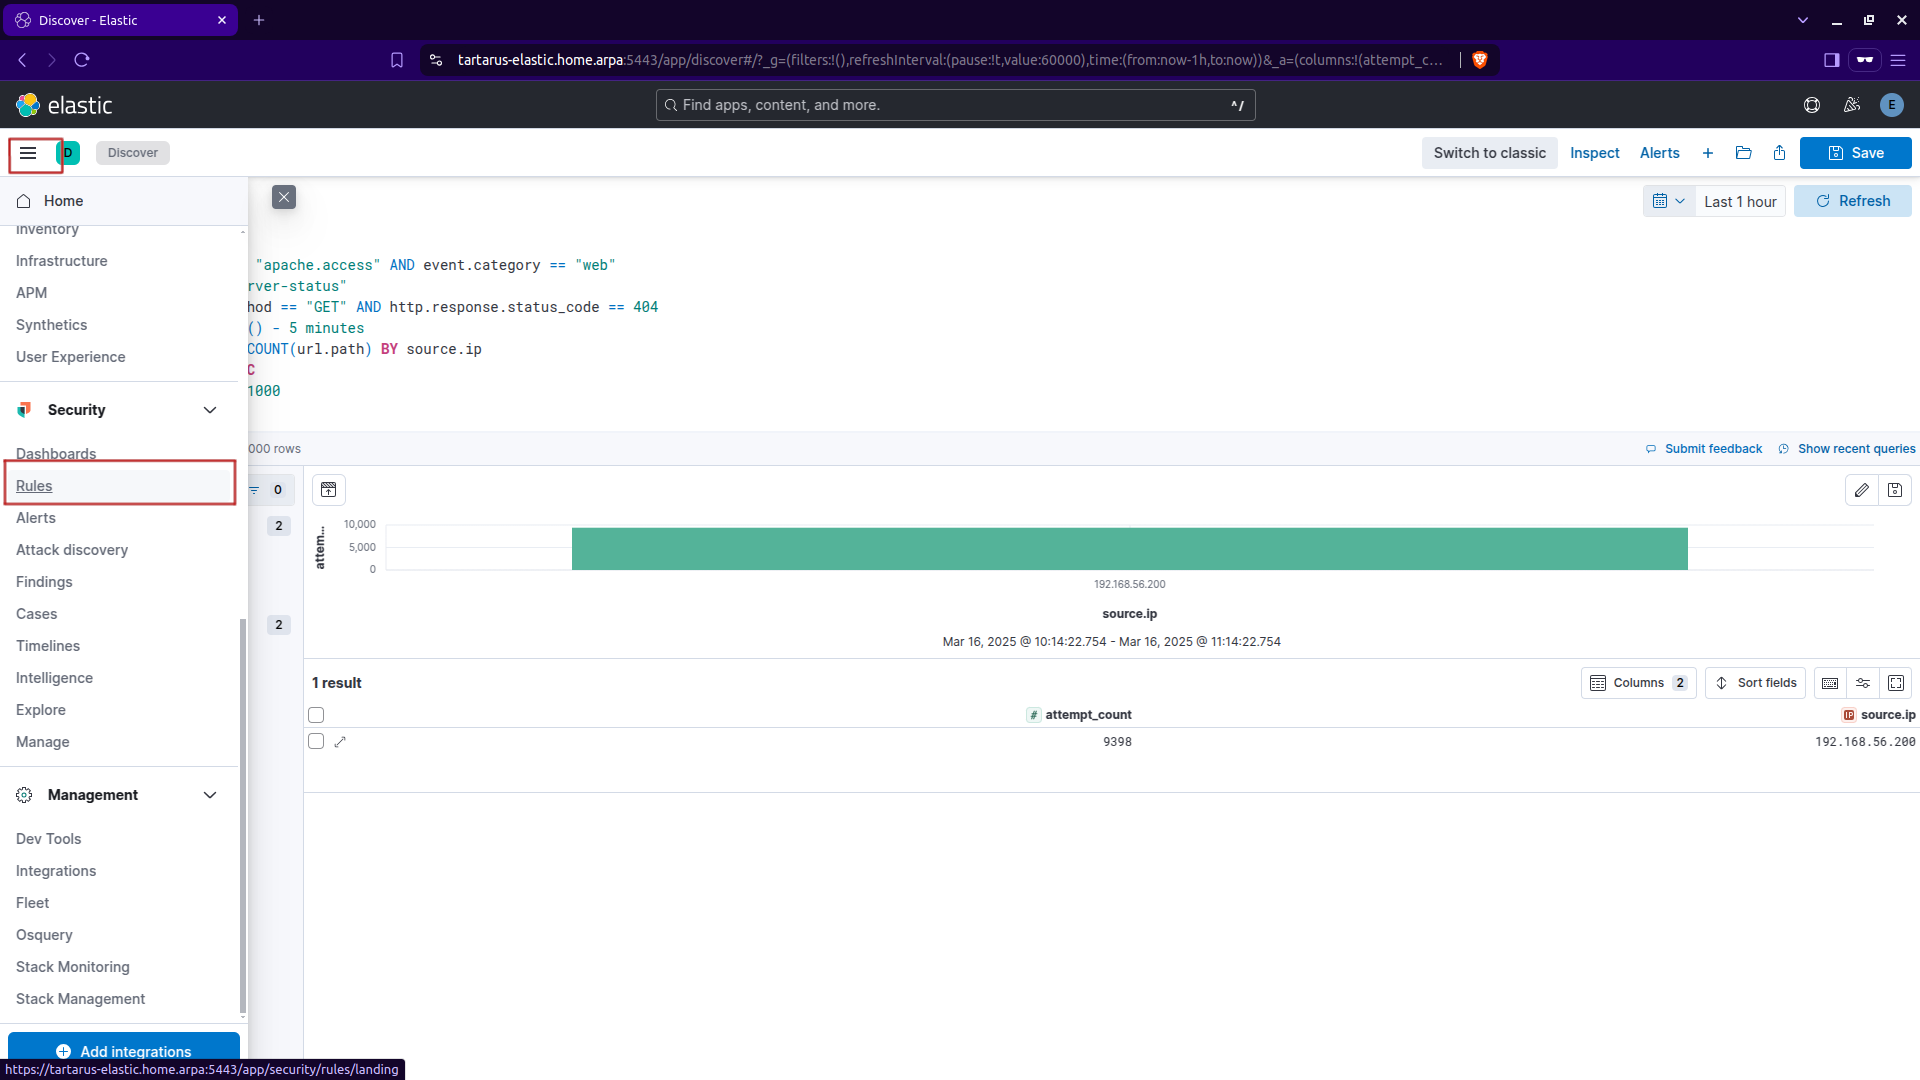 Kibana navigate to security section
Select the ‘Detection rules (SIEM)’ panel:
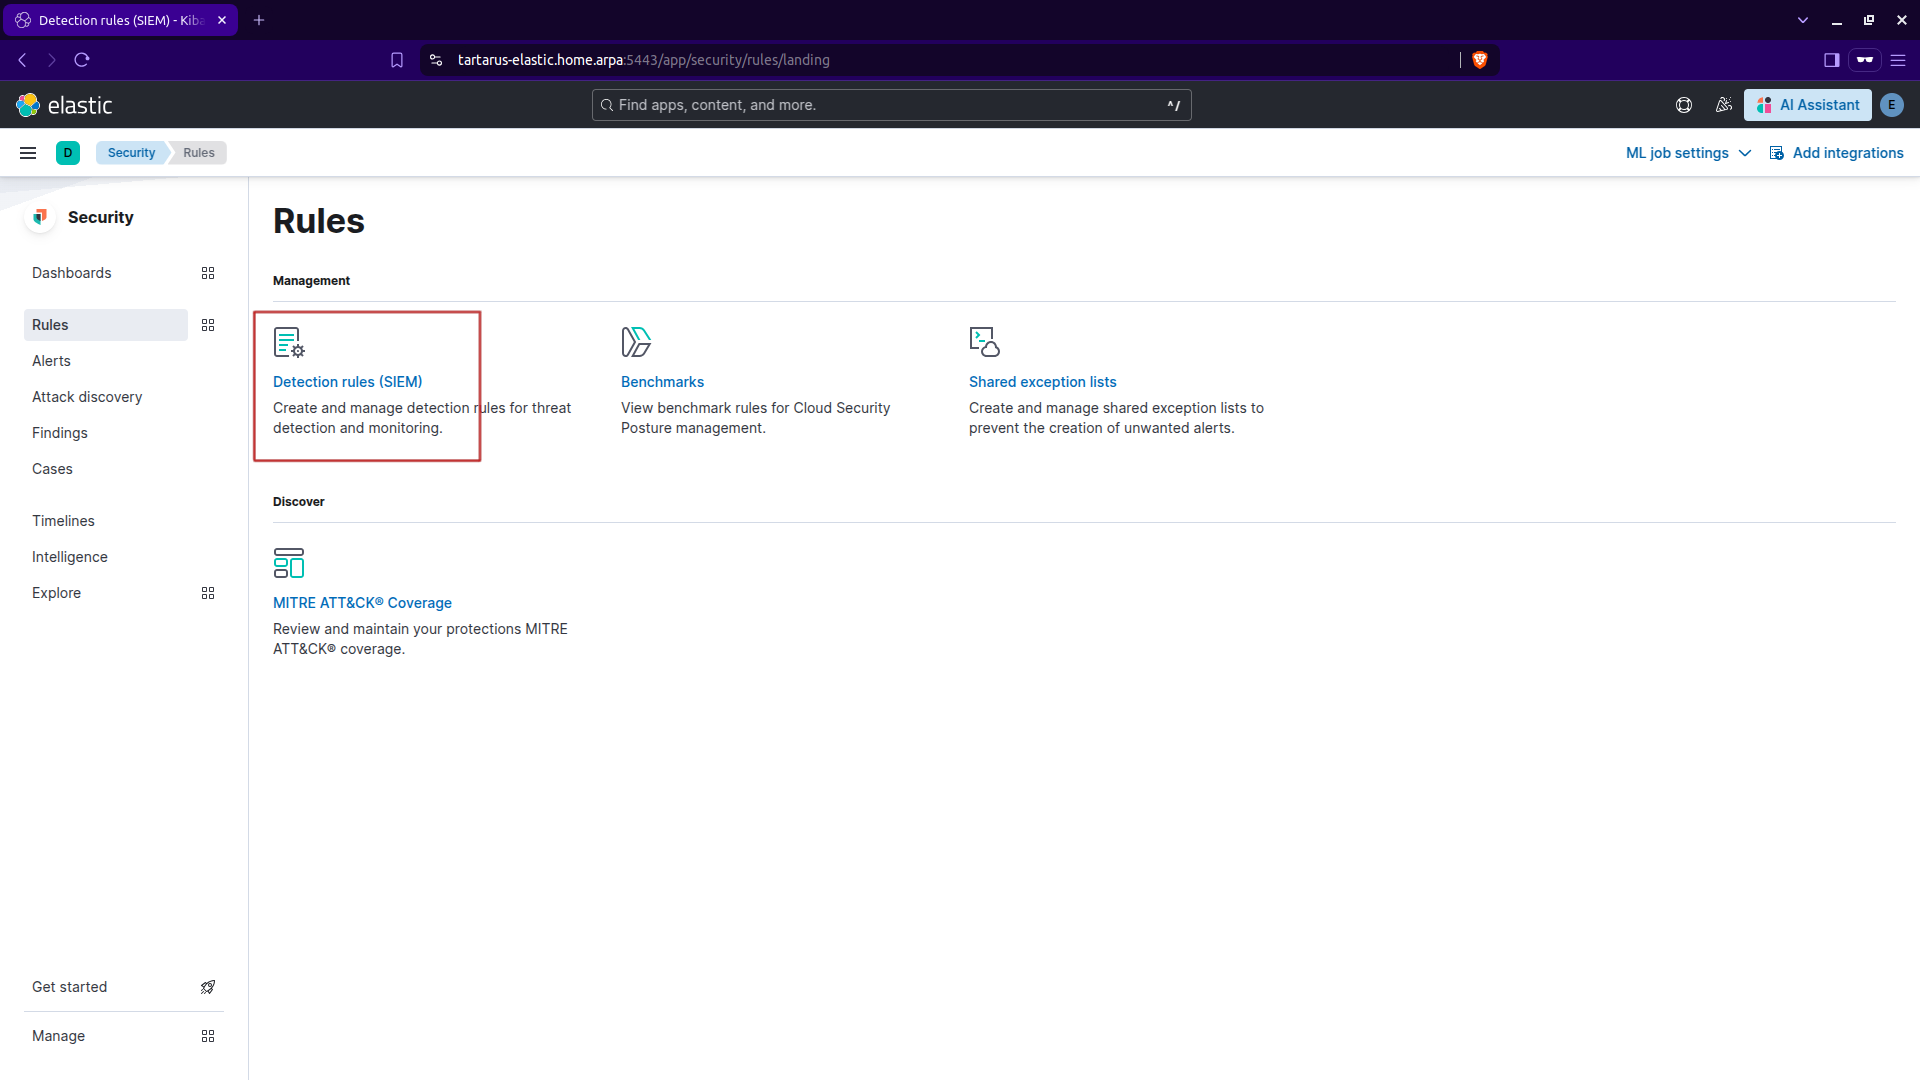 Kibana nav to create rule page
Select the ‘Create new rule’ option:
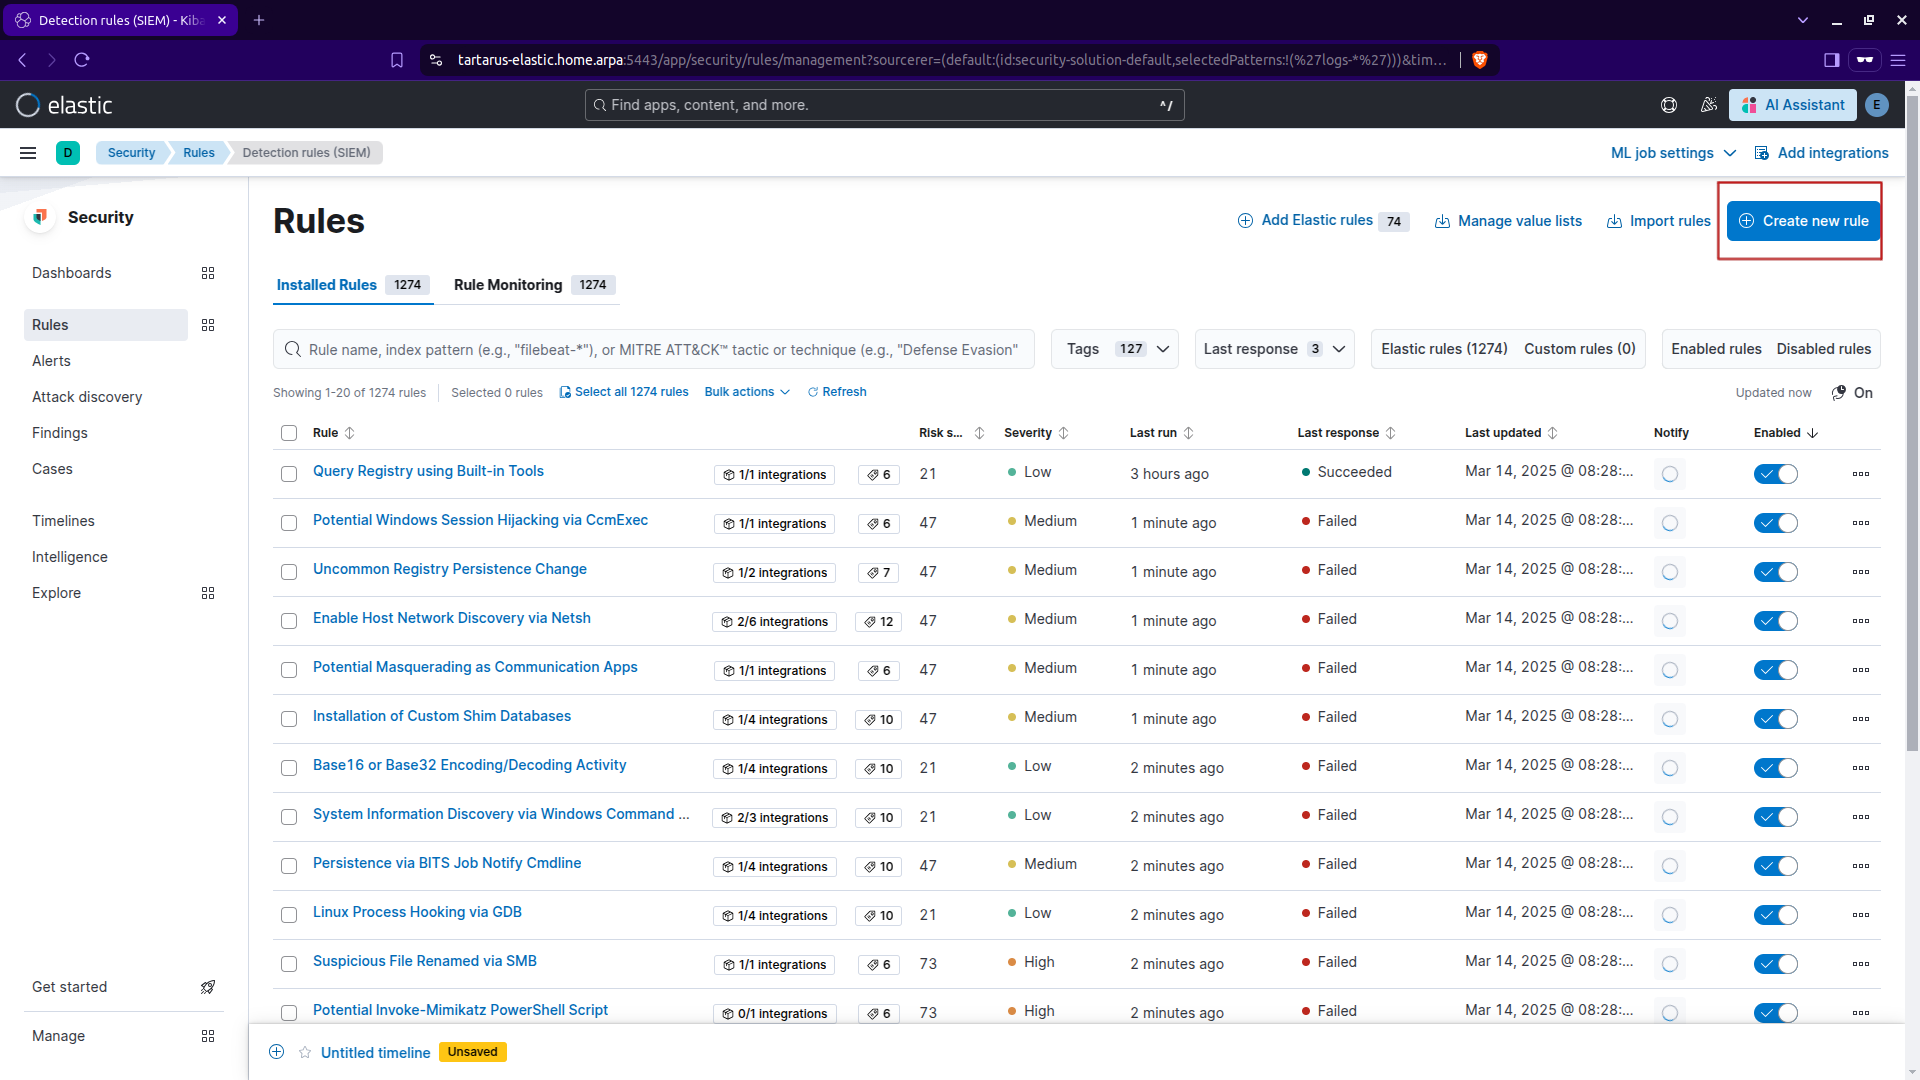 Kibana security create rule
Select the ES|QL Rule type:
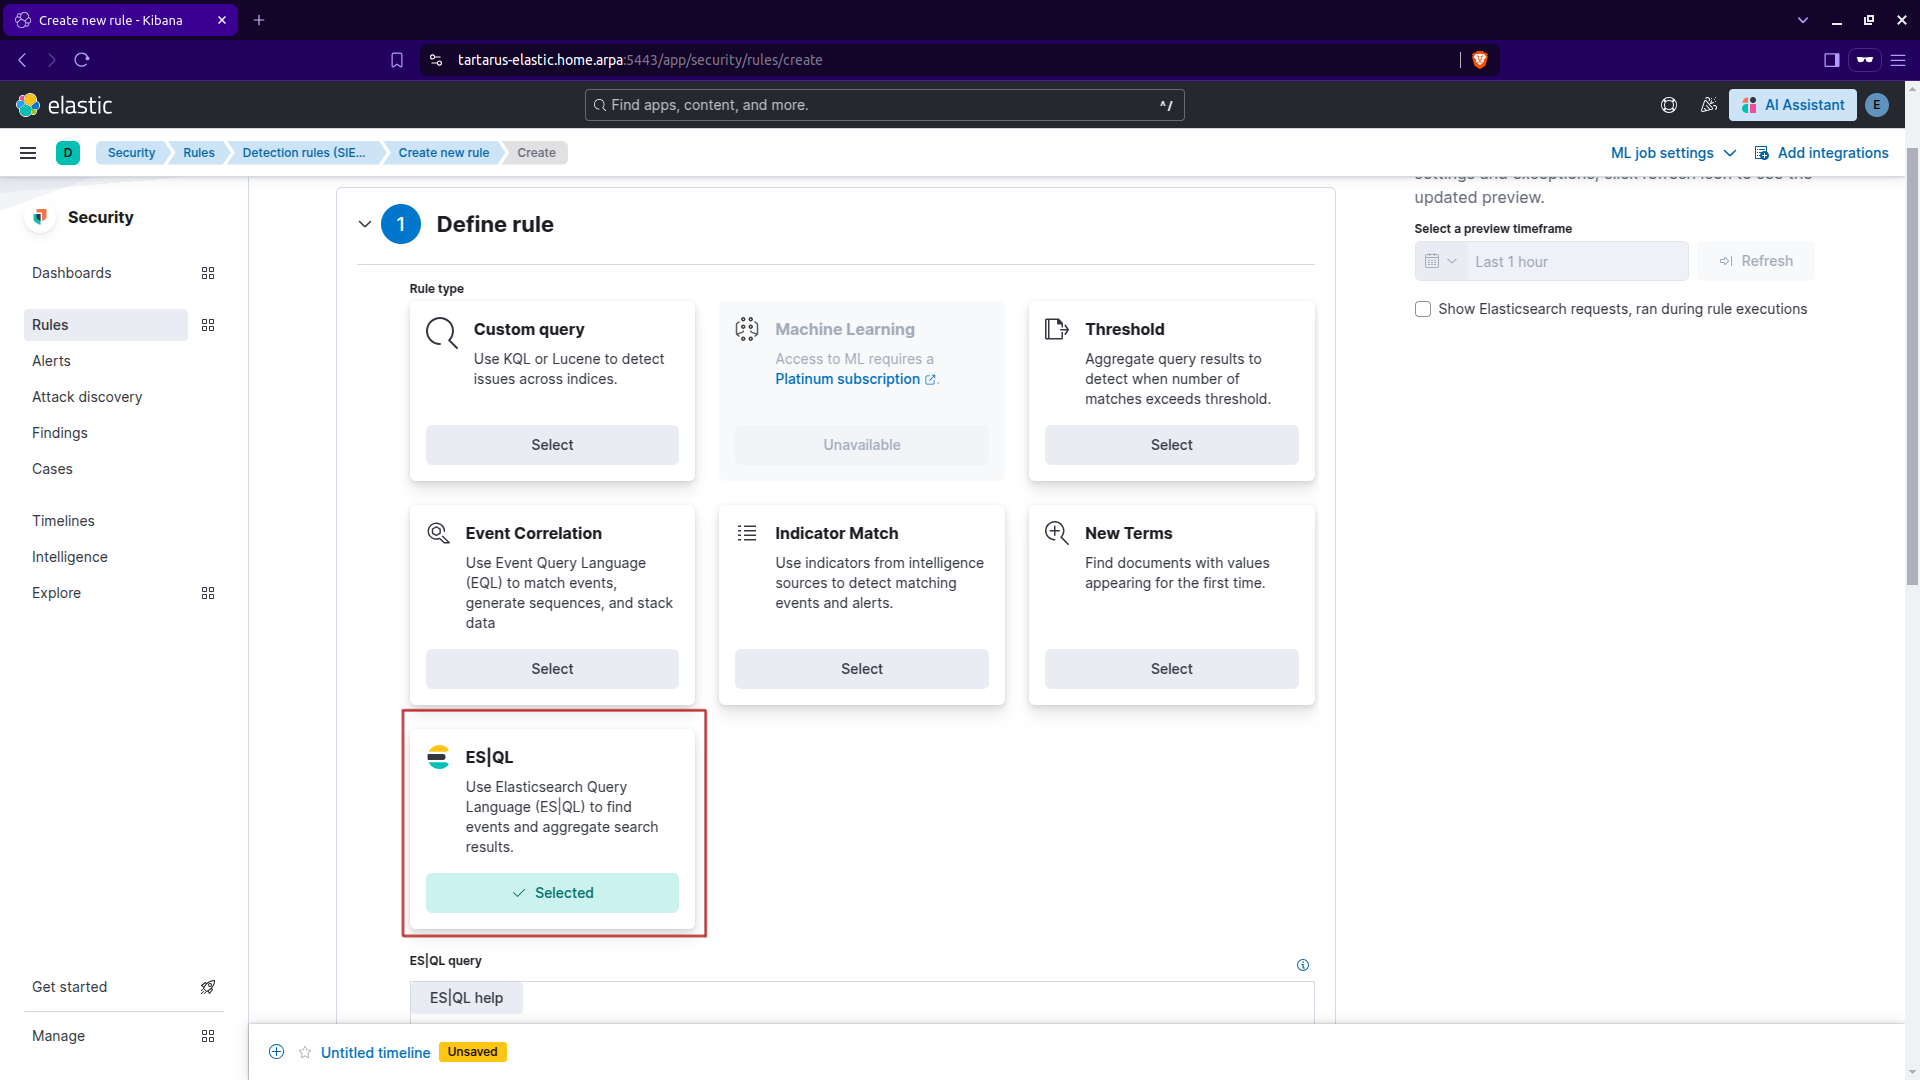 Kibana security create rule cont.
Now input the following search:
1
2
3
4
5
6
7
FROM logs-*
| WHERE event.dataset == "apache.access" AND event.category == "web"
| WHERE url.path != "/server-status"
| WHERE http.request.method == "GET" AND http.response.status_code == 404
| STATS attempt_count = COUNT(url.path) BY source.ip, host.name
| SORT attempt_count DESC
| WHERE attempt_count > 1000
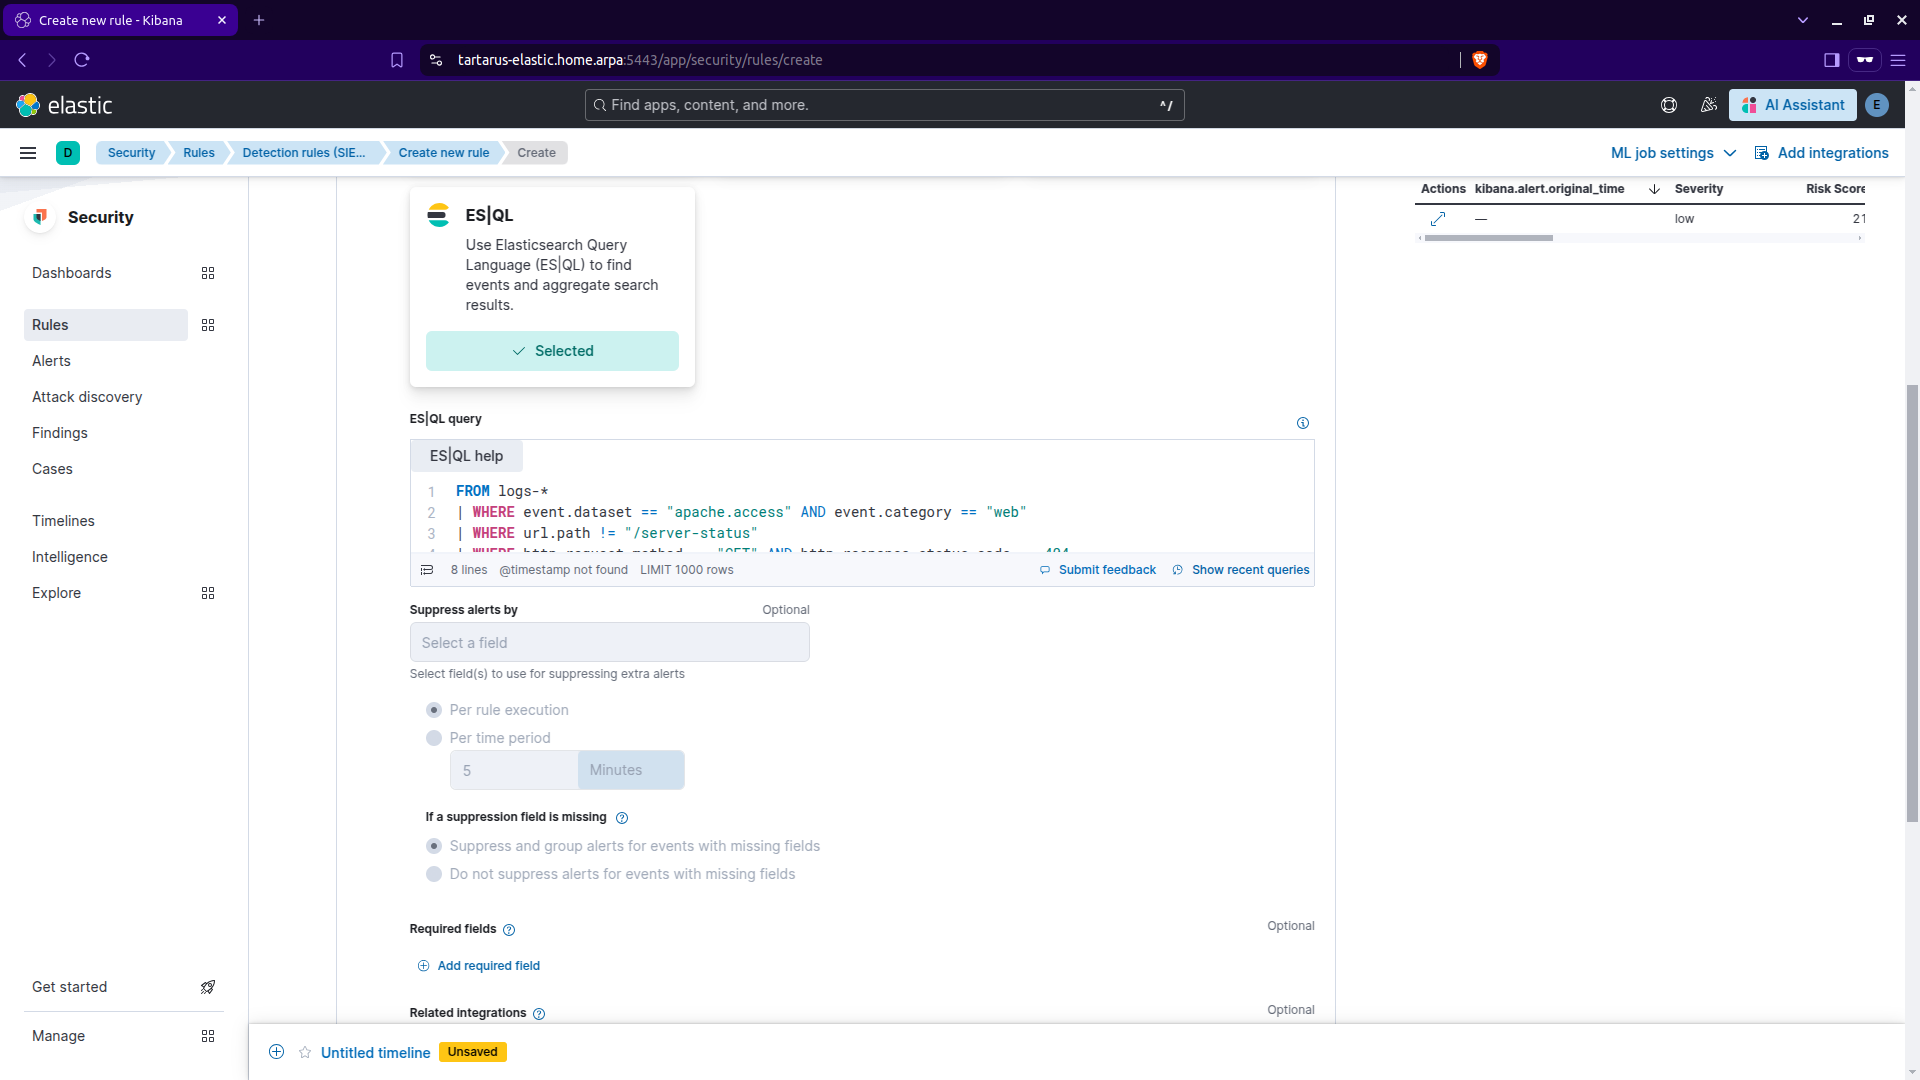 Kibana security create rule cont.
Click ‘Continue’ to move onto the next step ‘About rule’:
Give it a meaningful name and description.
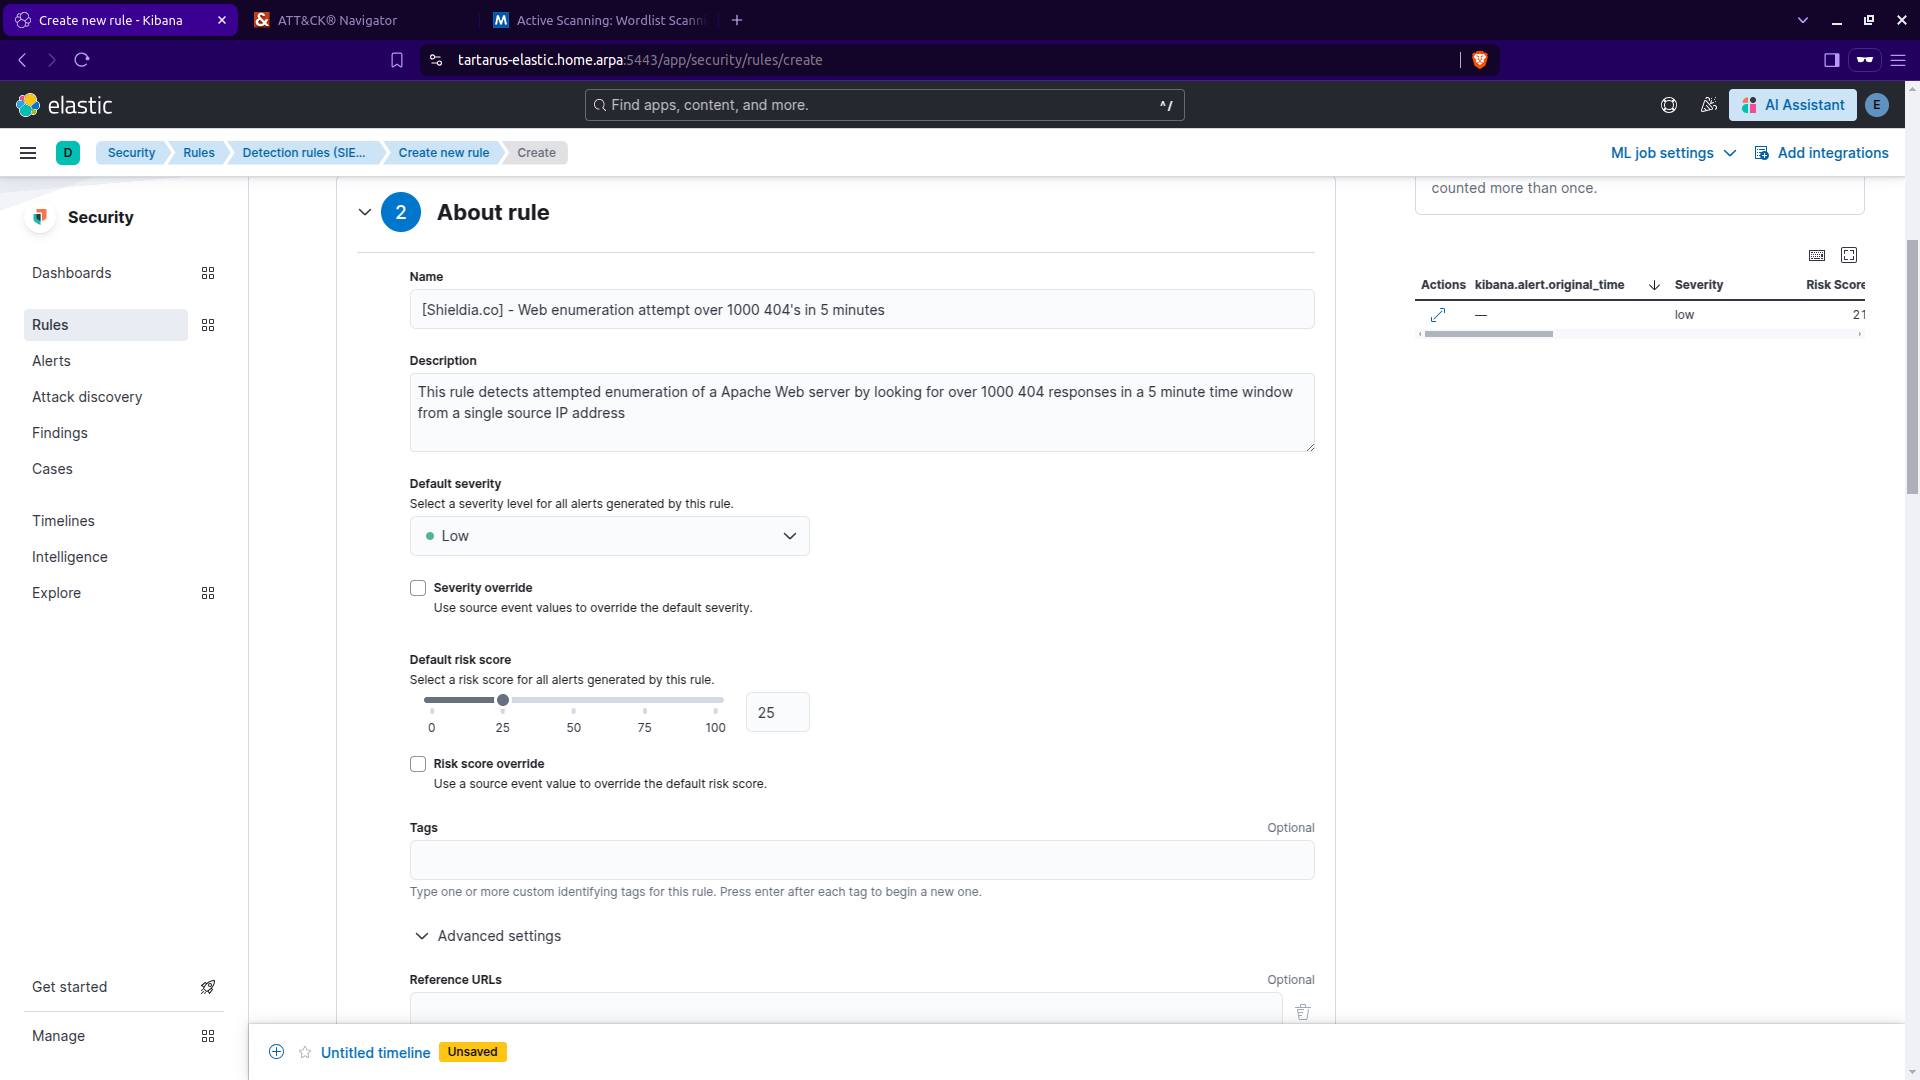 Kibana security create rule cont.
Scroll down and you can add a MITRE ATT&CK™ ID:
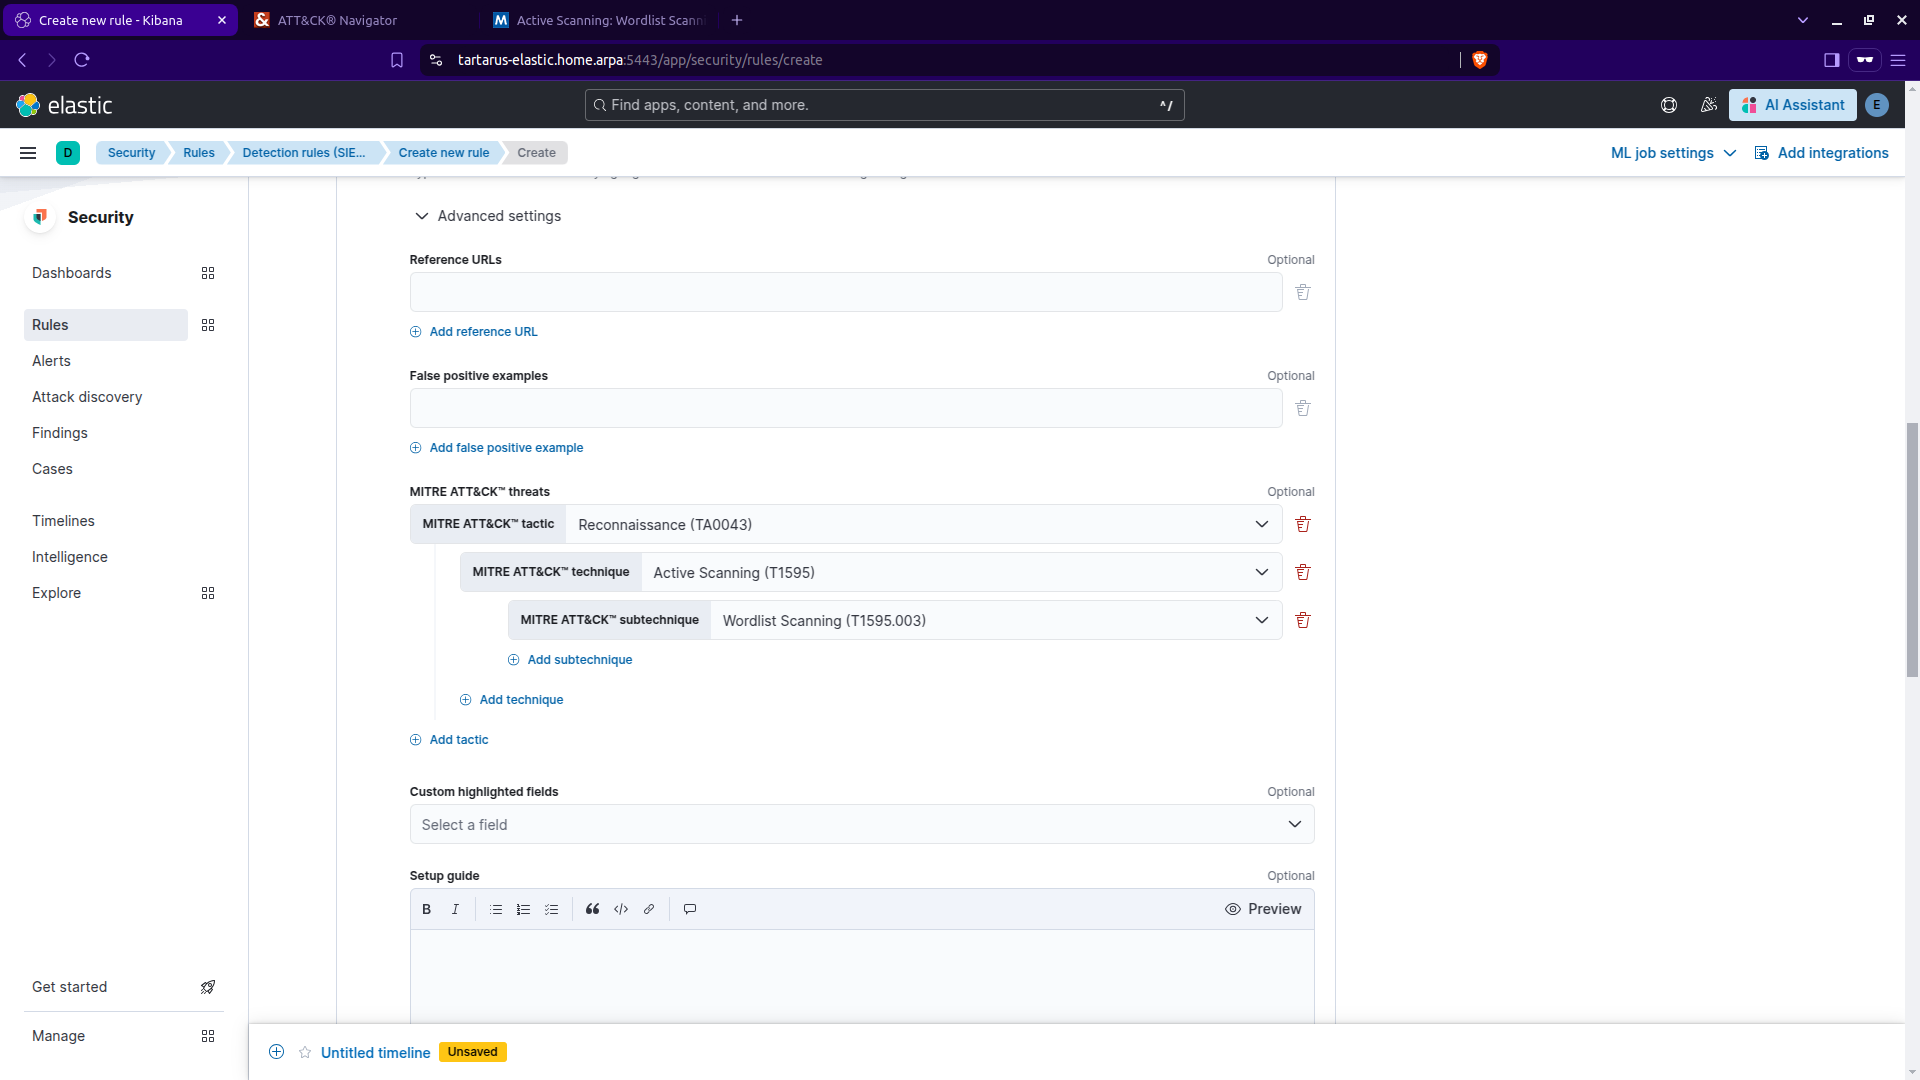 Kibana security create rule cont.
Click ‘Continue’. Under ‘Schedule rule’ keep the defaults:
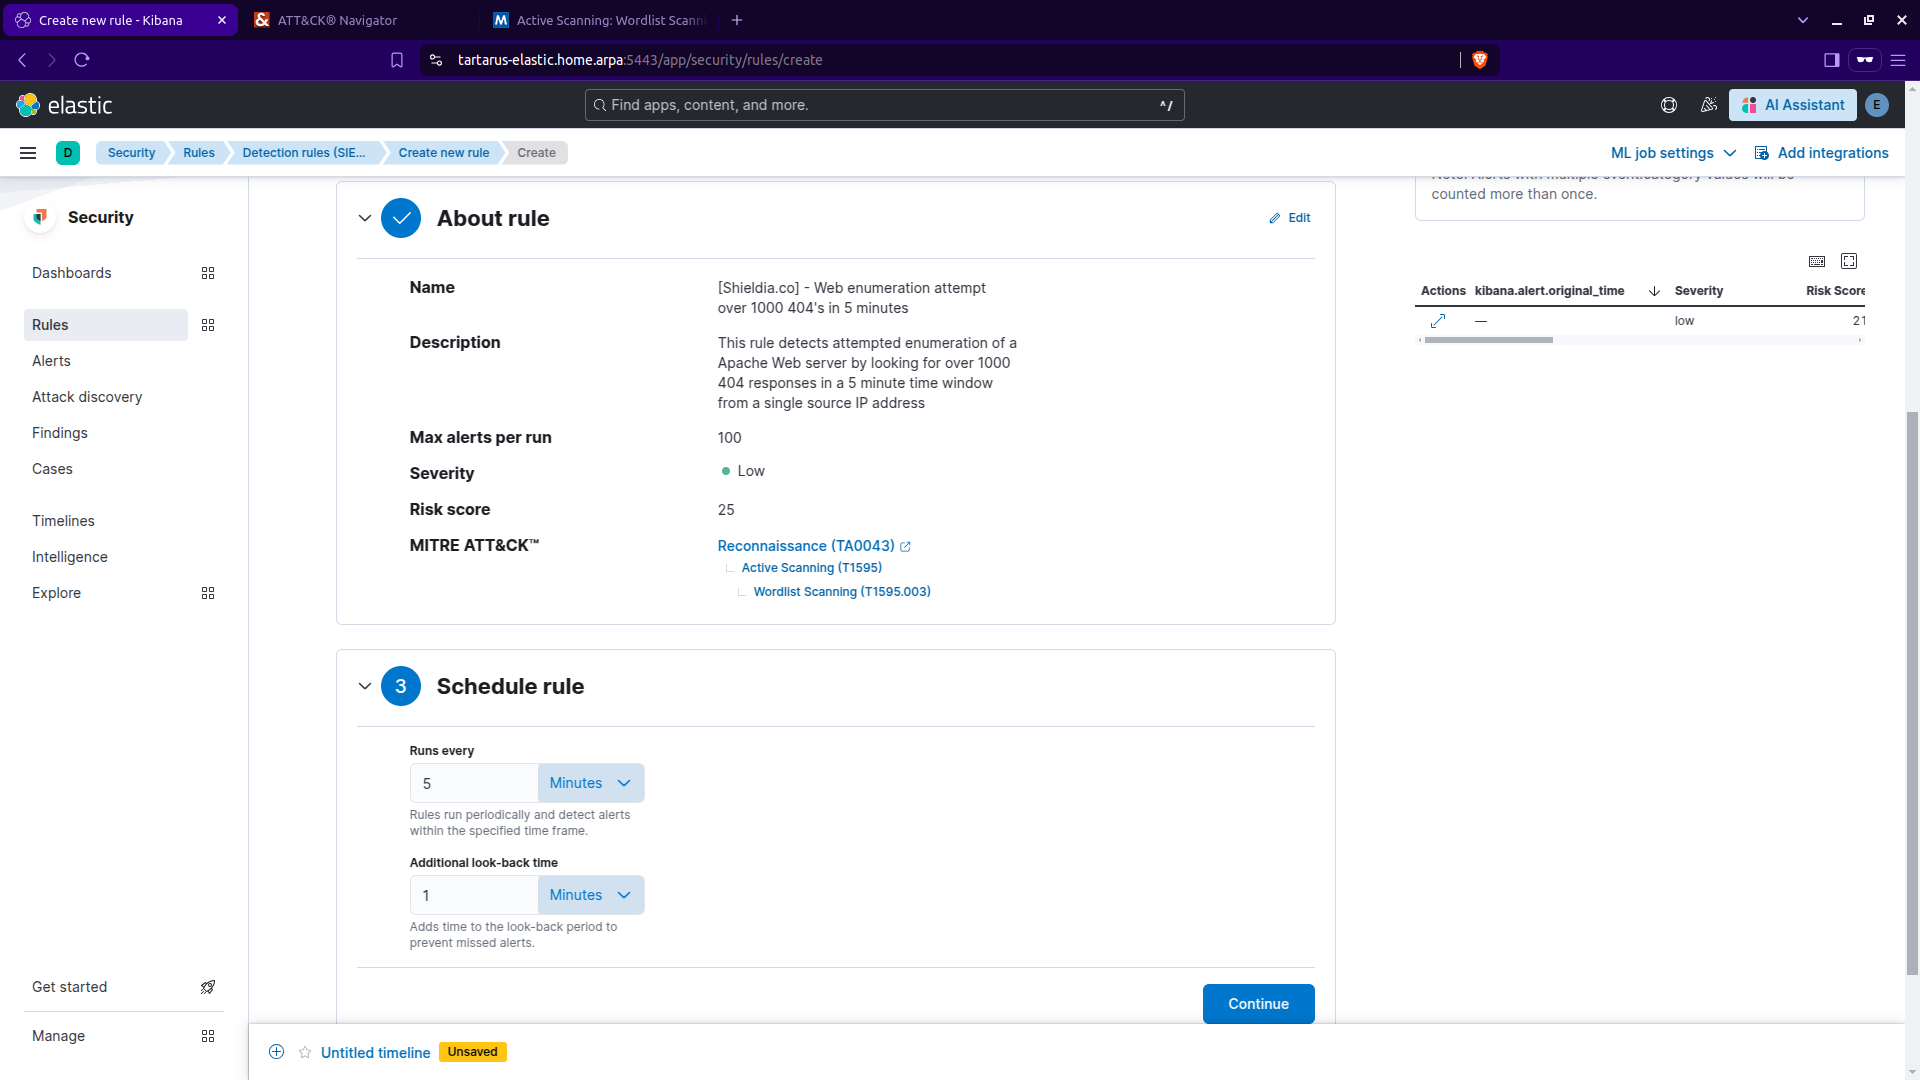 Kibana security create rule cont.
Click ‘Continue’. We won’t be using any ‘Rule actions’ so click ‘Create & enable rule’:
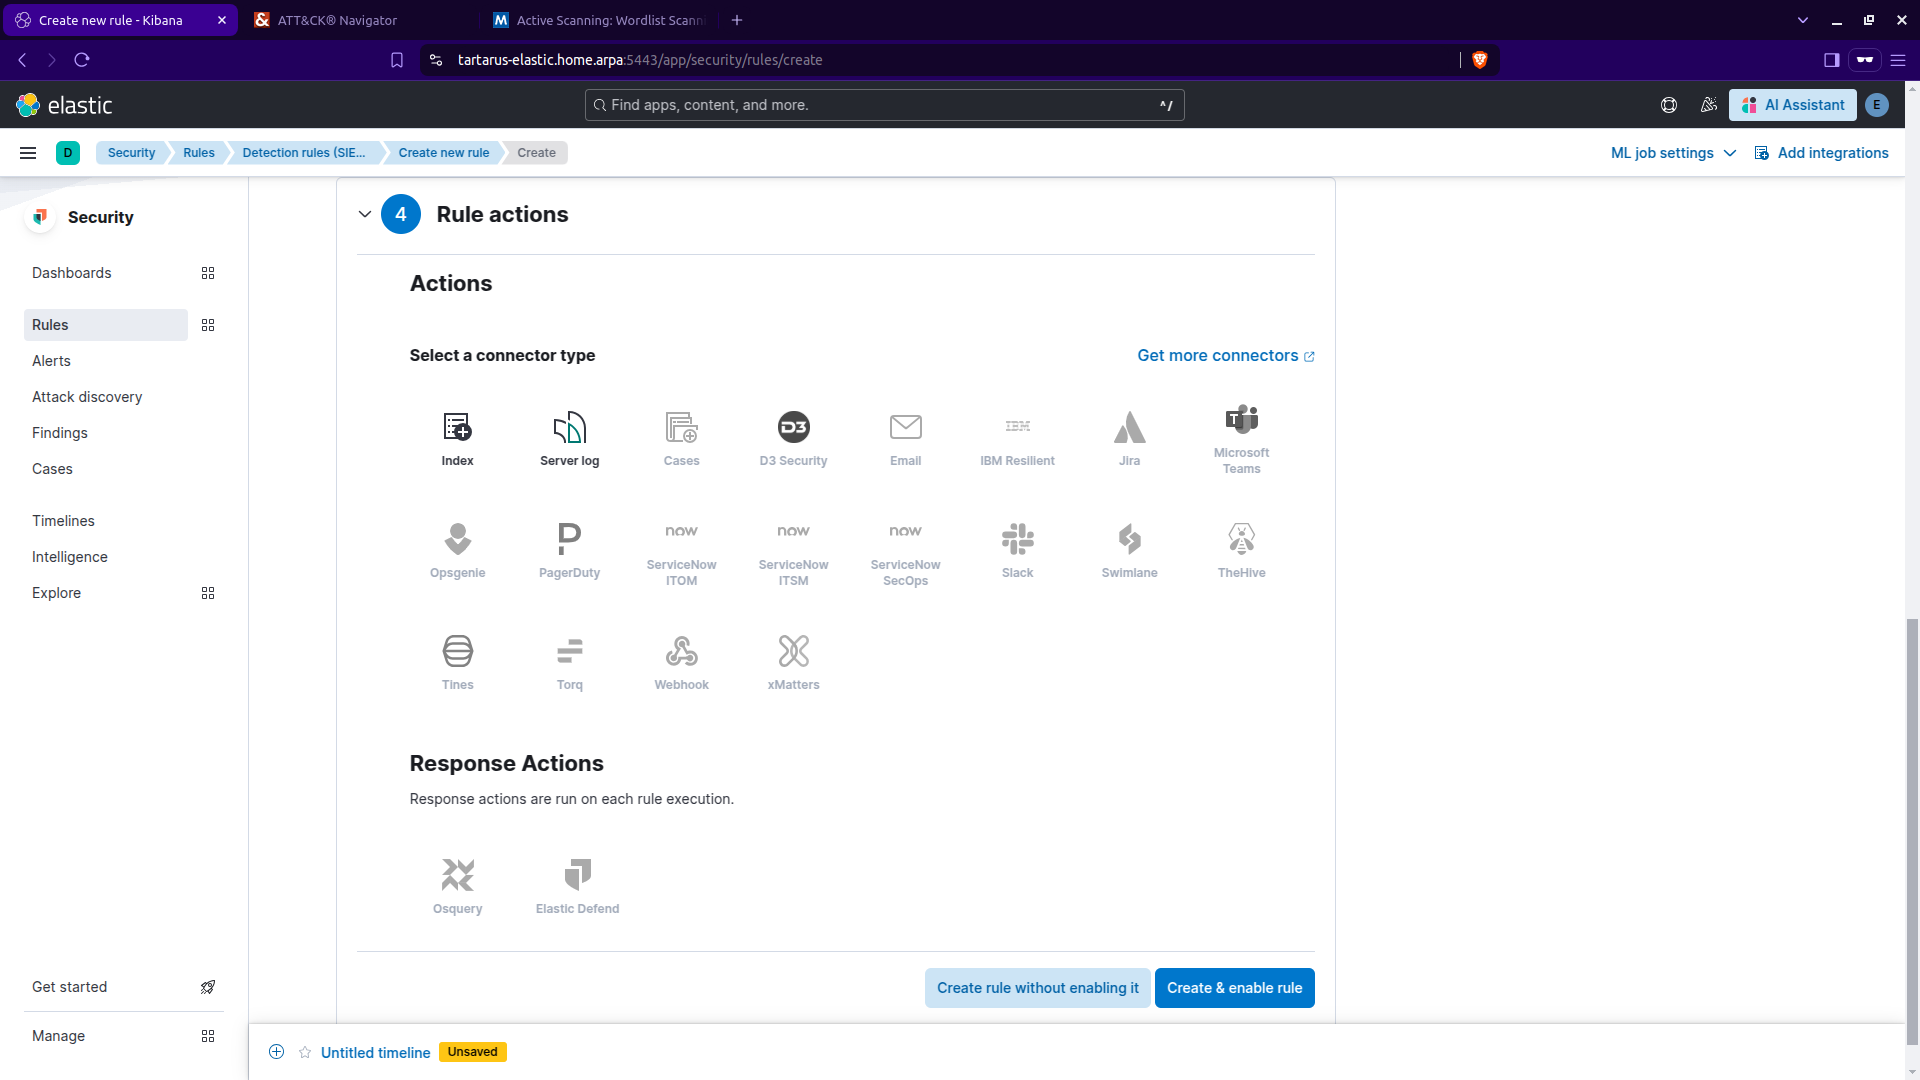 Kibana security create rule cont.
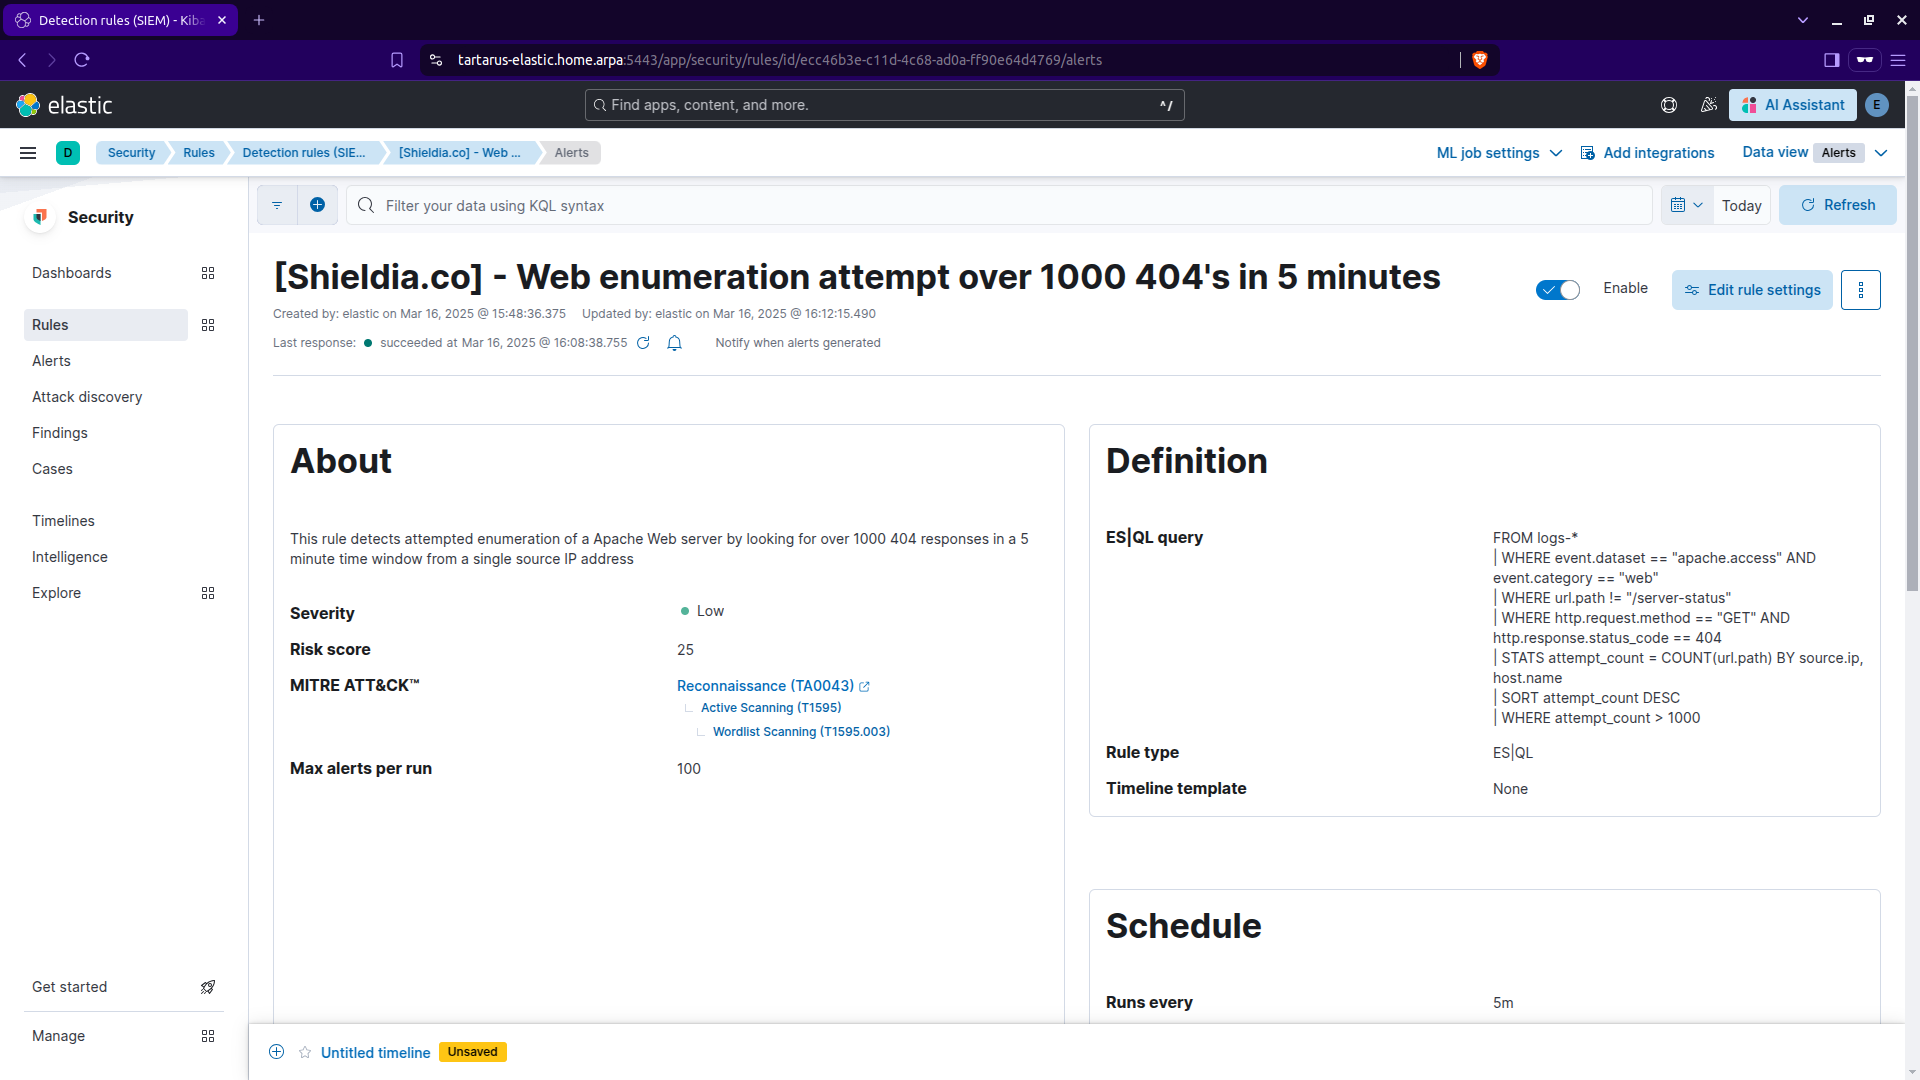 Kibana security rule created
Now run the following command in the Kali guest:
1
ffuf -H "User-Agent: Mozilla/5.0 (Windows NT 10.0; Win64; x64) AppleWebKit/537.36 (KHTML, like Gecko) Chrome/132.0.0.0 Safari/537.3" -w /usr/share/wordlists/seclists/Discovery/Web-Content/common.txt -u http://tartarus-dvwa.home.arpa:80/DVWA/FUZZ -mc 200 -r
And wait for alerts to flow in, navigate to the ‘Alerts’ tab https://tartarus-elastic.home.arpa:5443/app/security/alerts
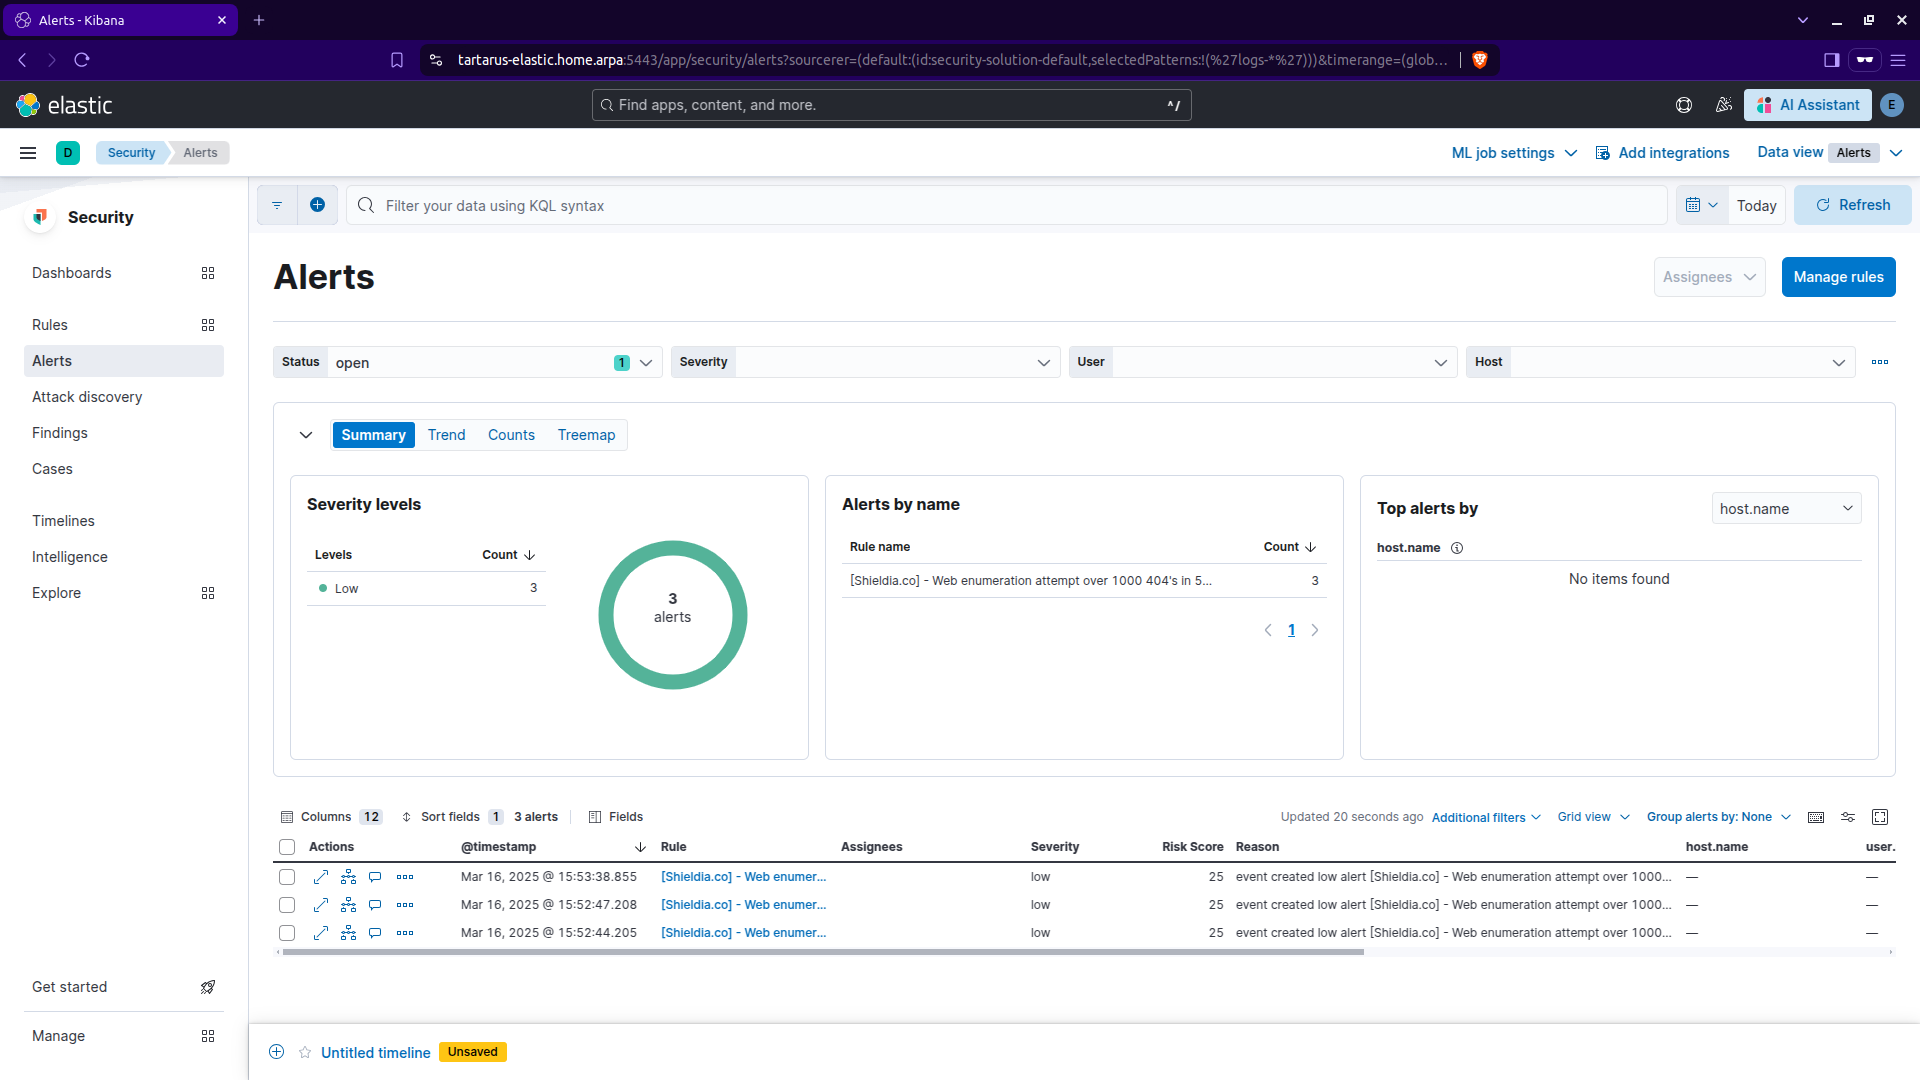 Kibana alerts tab
Congrats you’ve created your first rule!
As stated previously all other rules are imported for you. :)
Elastic Recon Rule Creation - Sigma
I’ve written three Sigma rules to detect the activity described above. In a later post I’ll cover how you can create your own Sigma rules.
The rules can be found in the Tartarus GitHub repository under the /rules/ directory
pfSense Correlation Port Scan Activity
Correlation rule to detect opening 1000 unique ports in a 5 minute window from a single source to a single destination, it also has (what I’m calling) a Threat Hunting Rule that relaxes the detection criteria, however the hunting rule doesn’t get enabled when ingested into Elastic. I’ve had to write transformation pipelines to map Sigma keywords to ECS and a new template file to disable rules that start with ‘threat_hunt_*’.
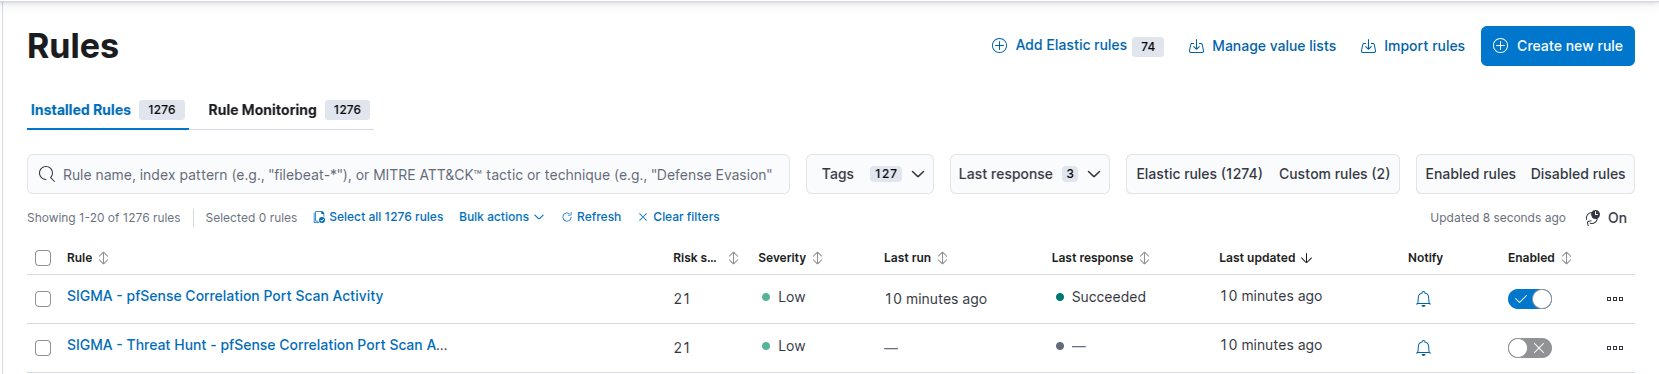 Kibana sigma rules to detect port scan
Alerts for this rule will look like this:
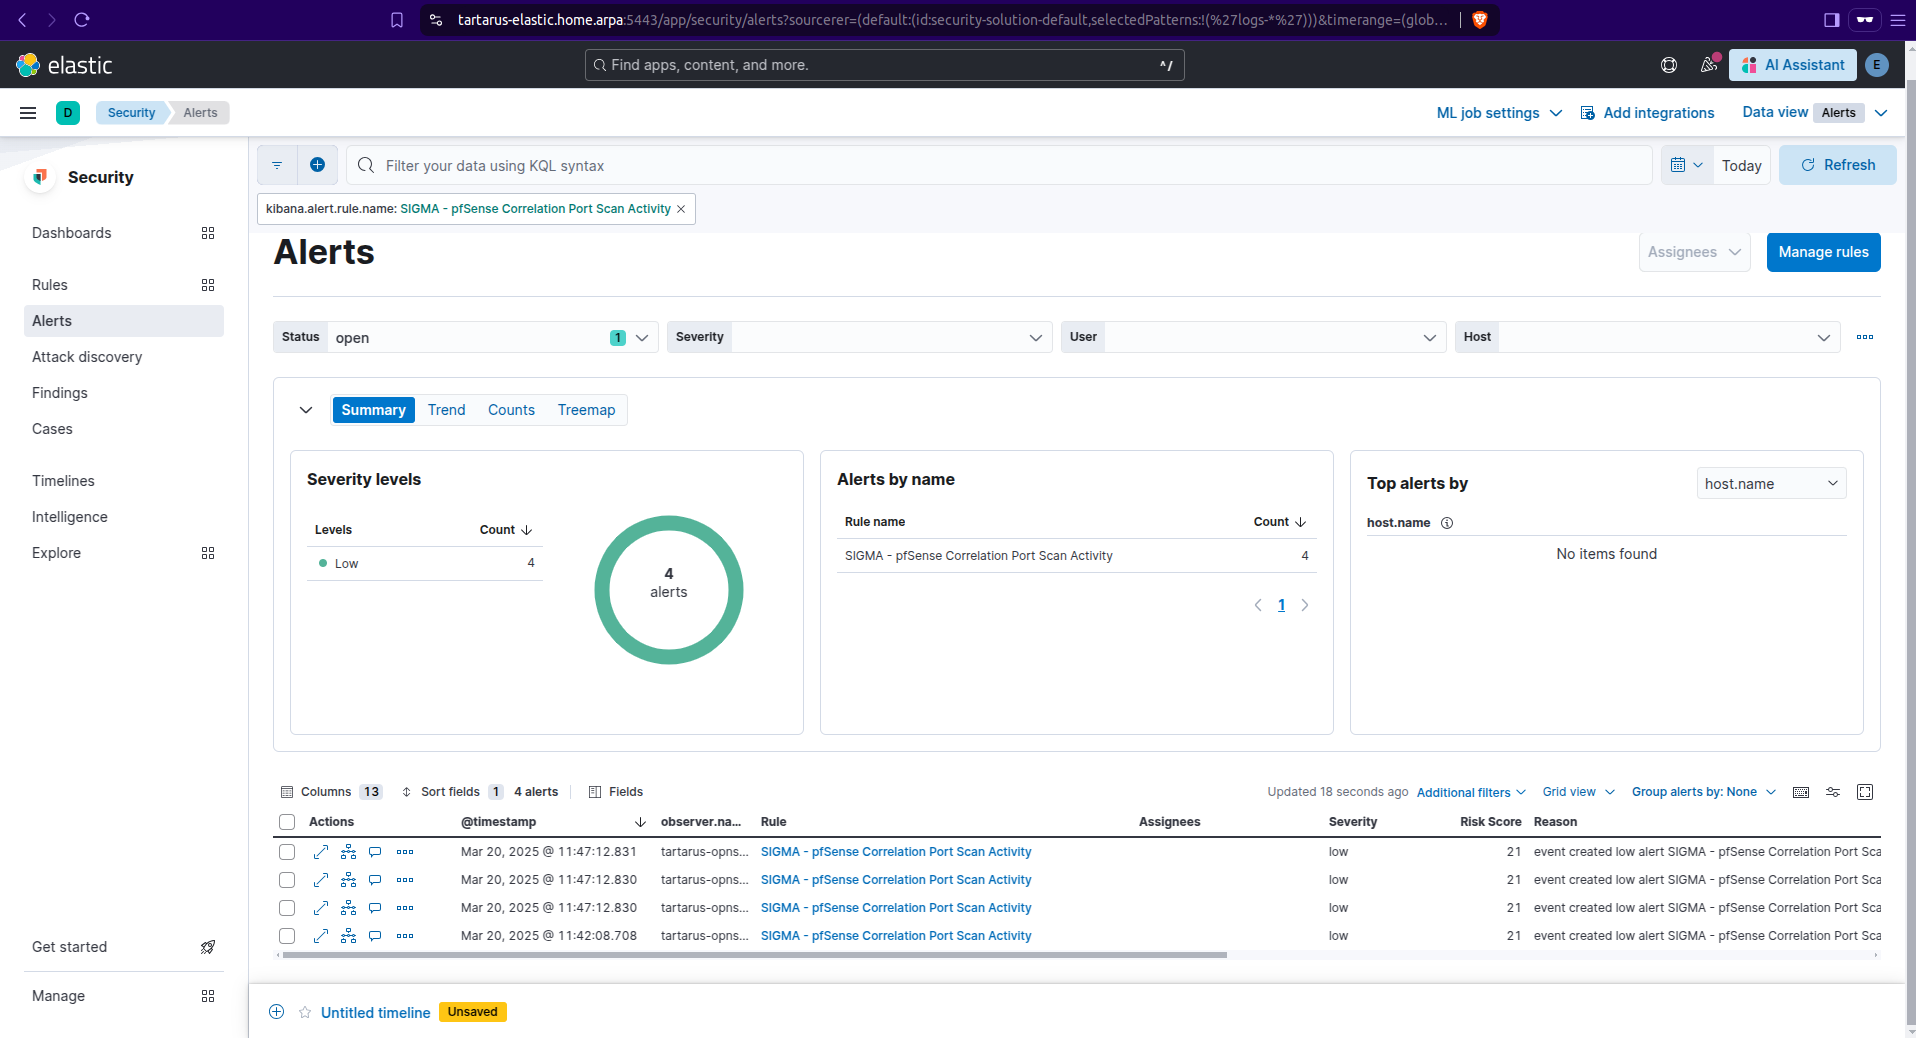 Kibana security example pfsense alerts
Web Apache Correlation Hack Tool User Agent
This rule is similar to - the man, the myth, the legends - Florian Roth’s own rule Hack Tool User Agent however I’ve made some small modifications; added new User-Agents, refactored some, changed the log source and converted it to a correlation rule due to the fact that this command would generate ~47,000 alerts:
1
ffuf -u "http://tartarus-dvwa.home.arpa/FUZZ" -mc 200 -r -w <(pencode -input /usr/share/wordlists/seclists/Fuzzing/1-4_all_letters_a-z.txt upper)
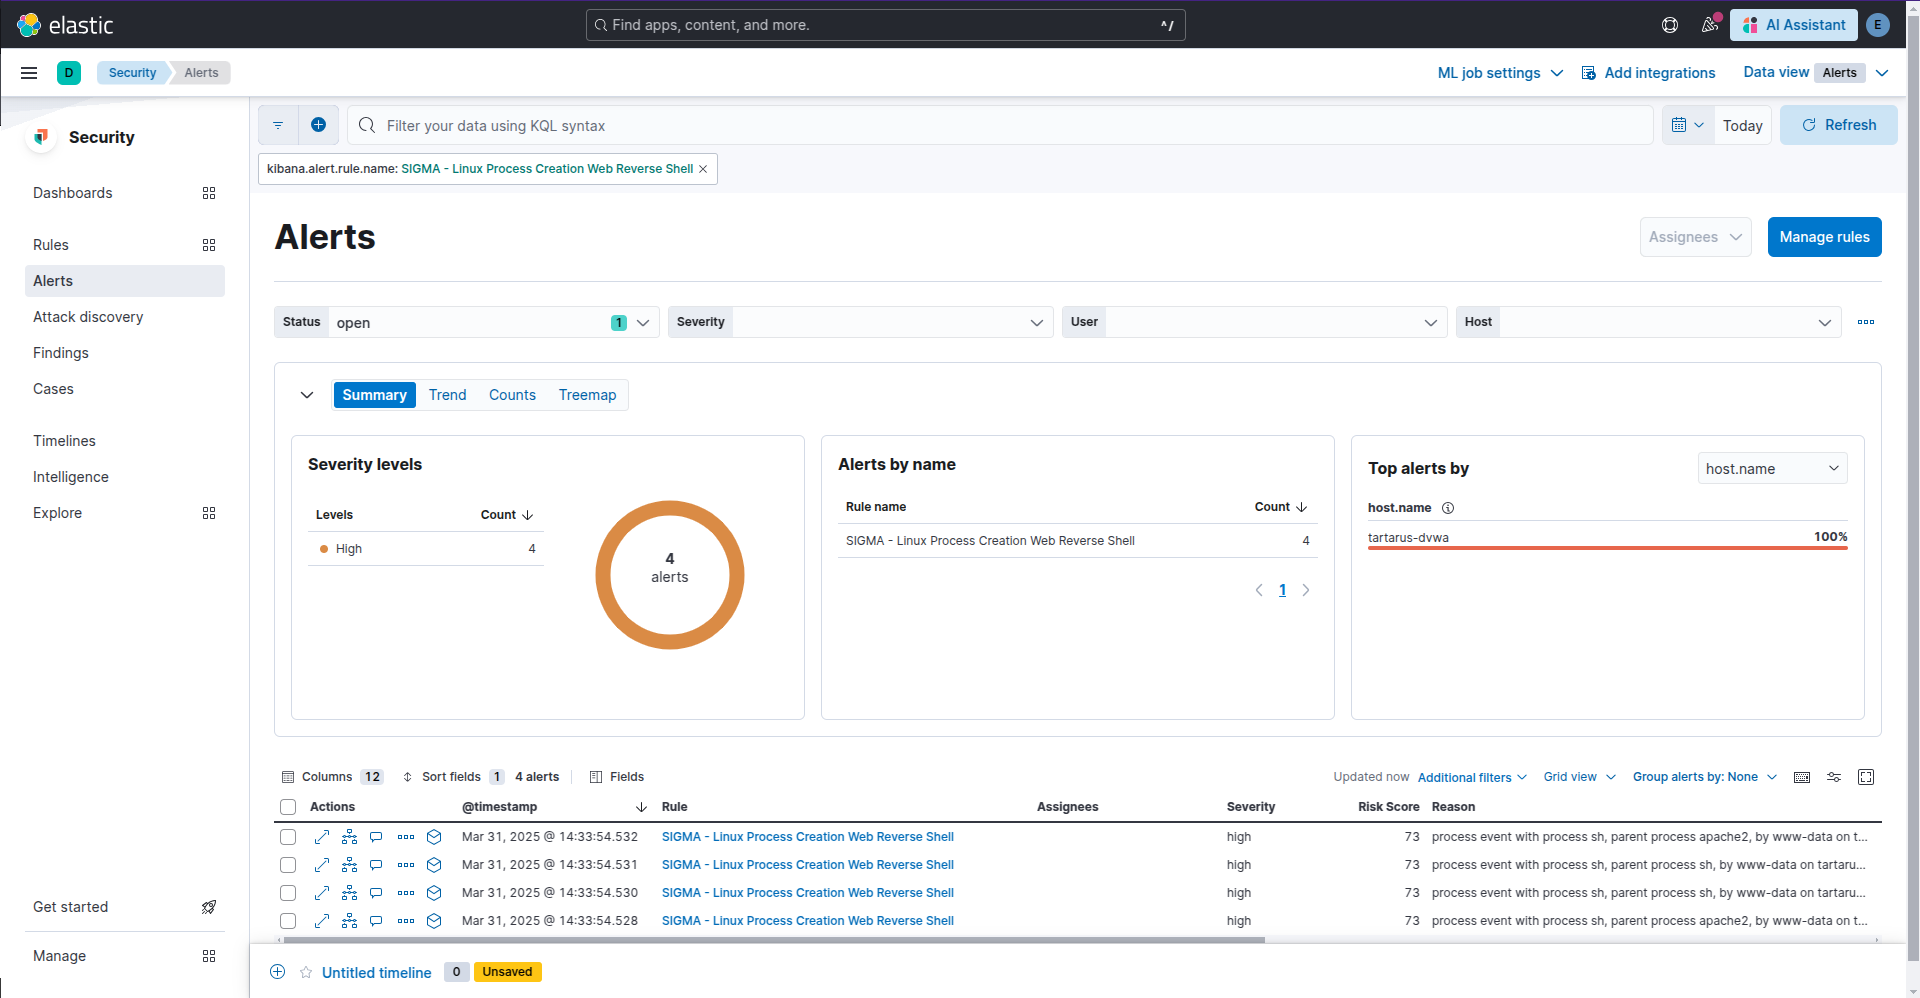 Kibana sigma rule sus user agent alerts
Web Apache Correlation Directory Enumeration
This is a new rule to detect the activity above in a more generic way, the same caveats as before apply, if the TA has hundreds of thousands of Proxy Chains and they are enumerating one directory per Chain, this rule isn’t for you. There is a way to discombobulate the Blue Team, that will be covered in the medium post.
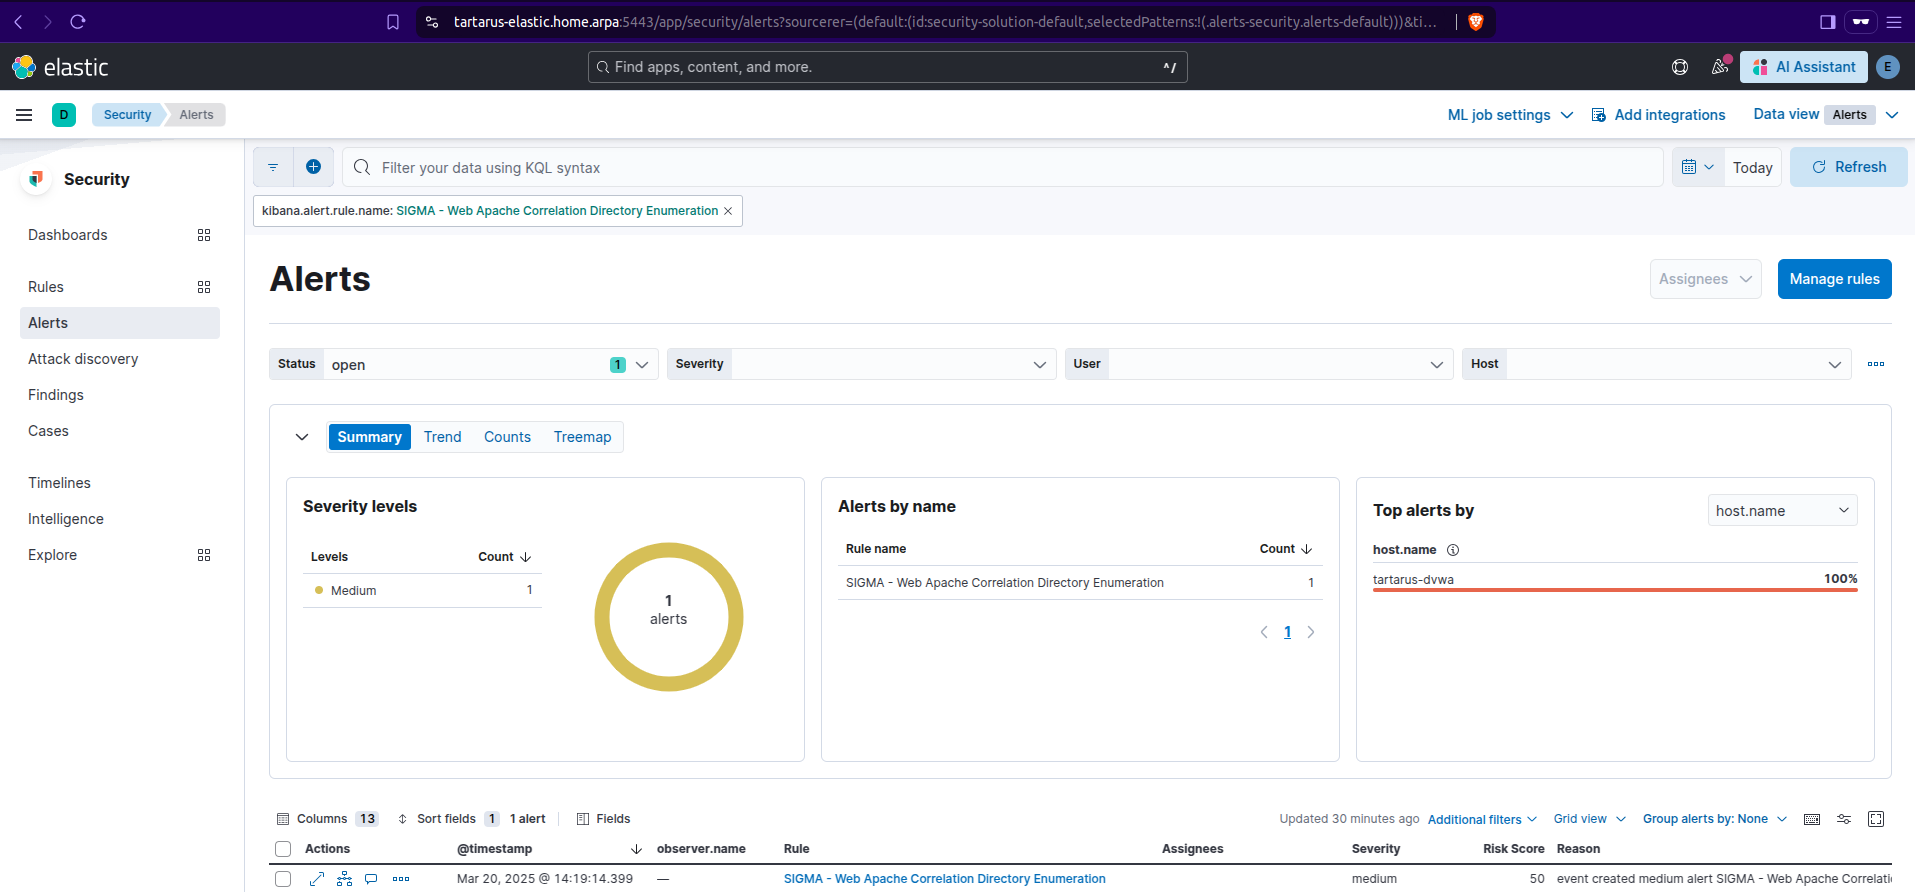 Kibana sigma rule dir enum alerts
Credits
Image thanks to Nasa AS11-44-6549
Icon thanks to Show-password icons created by juicy_fish - Flaticon